> ## Documentation Index
> Fetch the complete documentation index at: https://guide.garde.app/llms.txt
> Use this file to discover all available pages before exploring further.
# Inventory
> Manage items, orders, invoices, counts, and variance.
This is where food cost gets won or lost. The loop is simple: buy (purchase orders, invoices), track (items, recipes), count (count sheets, adjustments), then compare (AvT variance). Every page in the Inventory section serves one step of that loop.
Staff do the floor work (invoice photos, counts, orders) from the [Garde app](/mobile/inventory). This page covers the dashboard side.
## Inventory Home
Start here. It's the scoreboard for the whole section.
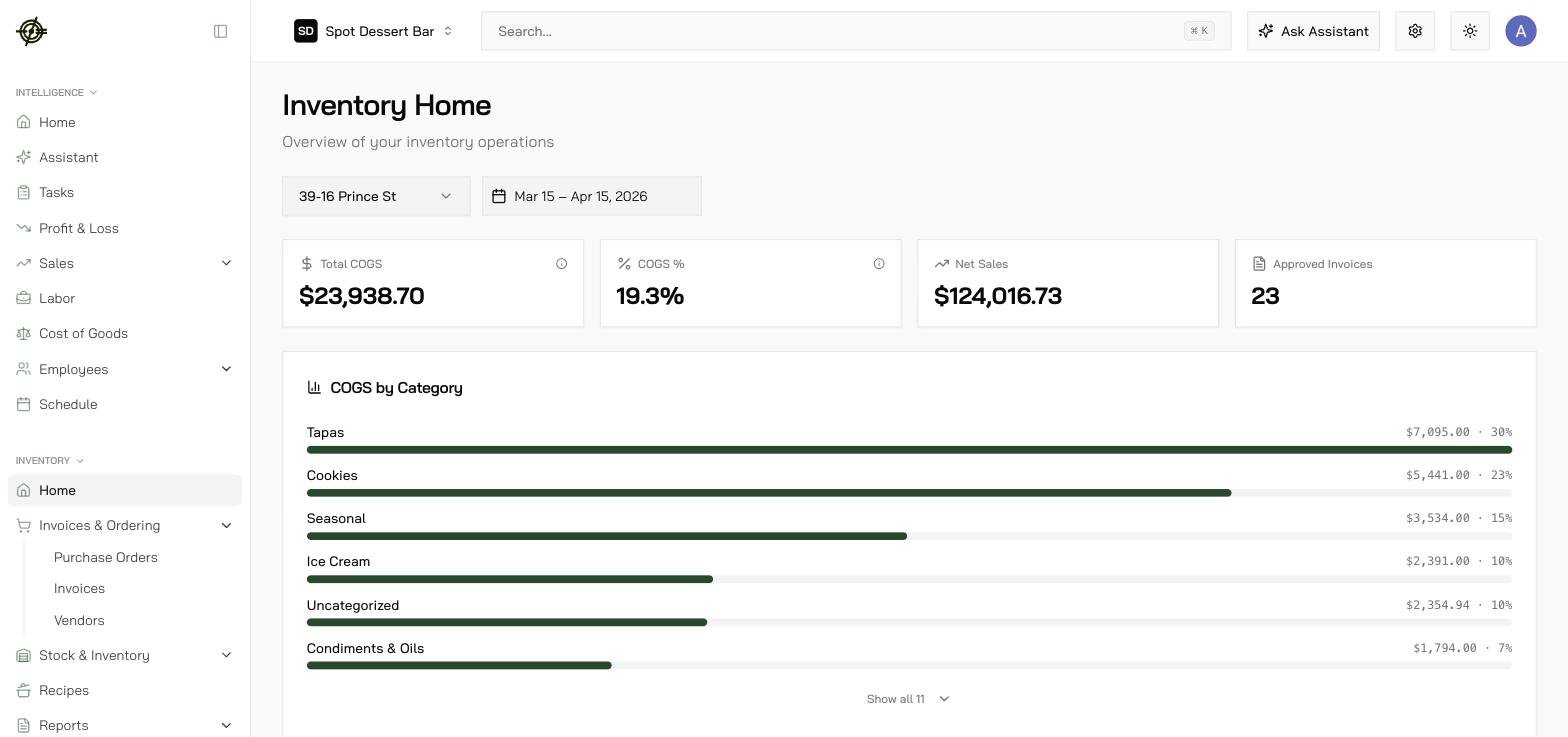 * **Total COGS** and **COGS %** for the date range. $15,164.00 at 19.8% of $76,613 net sales is healthy; the percent is the number to watch, not the dollars.
* **COGS by Category**: where the money goes. Here Tapas (34%), Ice Cream (29%), and Cookies (20%) are 83% of spend. Chase variance in those three categories before anything else.
* **Biggest Price Movers (30 days)**: items whose invoice price jumped. Matcha ice cream going $36 to $41 (+13.9%) is a call to the vendor or a menu price review, and you see it the week it happens.
* **Action Items**: your cleanup queue. 134 invoices pending review, 109 items missing vendor mapping, 21 recipes needing attention. Every one of these degrades the numbers everywhere else. Work them down.
## The Command Center
**Command Center** is the AI-summarized view of the same loop: it reads your variance, reorder needs, and price movers and tells you what to do about them.
* **Total COGS** and **COGS %** for the date range. $15,164.00 at 19.8% of $76,613 net sales is healthy; the percent is the number to watch, not the dollars.
* **COGS by Category**: where the money goes. Here Tapas (34%), Ice Cream (29%), and Cookies (20%) are 83% of spend. Chase variance in those three categories before anything else.
* **Biggest Price Movers (30 days)**: items whose invoice price jumped. Matcha ice cream going $36 to $41 (+13.9%) is a call to the vendor or a menu price review, and you see it the week it happens.
* **Action Items**: your cleanup queue. 134 invoices pending review, 109 items missing vendor mapping, 21 recipes needing attention. Every one of these degrades the numbers everywhere else. Work them down.
## The Command Center
**Command Center** is the AI-summarized view of the same loop: it reads your variance, reorder needs, and price movers and tells you what to do about them.
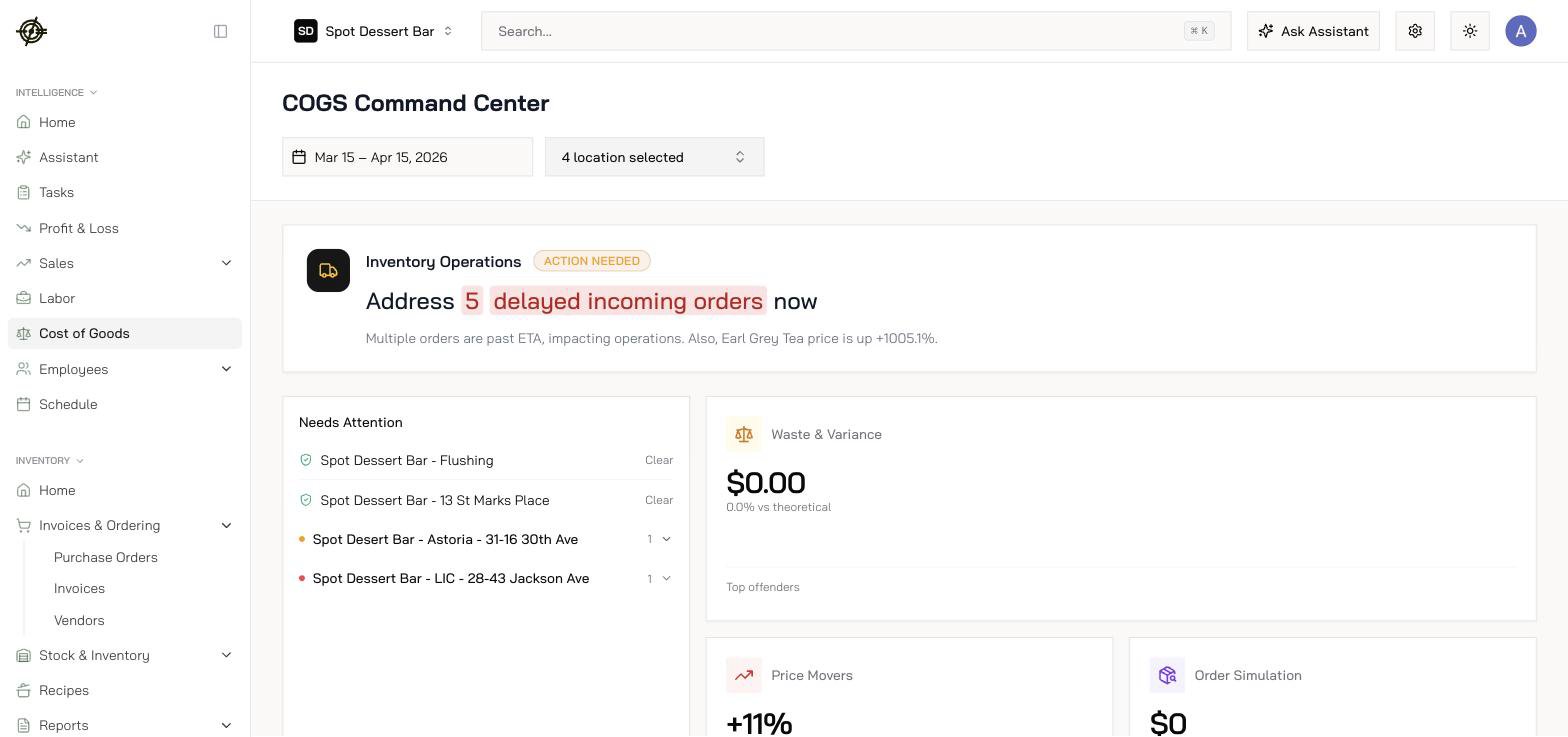 * The headline is written for you: "Address +\$14,969.86 variance, 53.1% over budget, driven by Jasmine Tea and Oreo Cookies." That's your week's inventory agenda in one sentence.
* **Items to Order** (69 items, \$4,452.50 here) is the reorder list built from usage and stock levels.
* The **Waste & Variance** cards show actual usage vs. theoretical, then the **Variance by Category** table breaks it down. Expand a category to see the items inside.
Open the Command Center weekly. It's faster than assembling the same picture from five pages.
## Set up the foundation
Do these once, in order. Everything downstream depends on them.
1. **Items**: your master list of everything you buy and track, grouped by category.
* The headline is written for you: "Address +\$14,969.86 variance, 53.1% over budget, driven by Jasmine Tea and Oreo Cookies." That's your week's inventory agenda in one sentence.
* **Items to Order** (69 items, \$4,452.50 here) is the reorder list built from usage and stock levels.
* The **Waste & Variance** cards show actual usage vs. theoretical, then the **Variance by Category** table breaks it down. Expand a category to see the items inside.
Open the Command Center weekly. It's faster than assembling the same picture from five pages.
## Set up the foundation
Do these once, in order. Everything downstream depends on them.
1. **Items**: your master list of everything you buy and track, grouped by category.
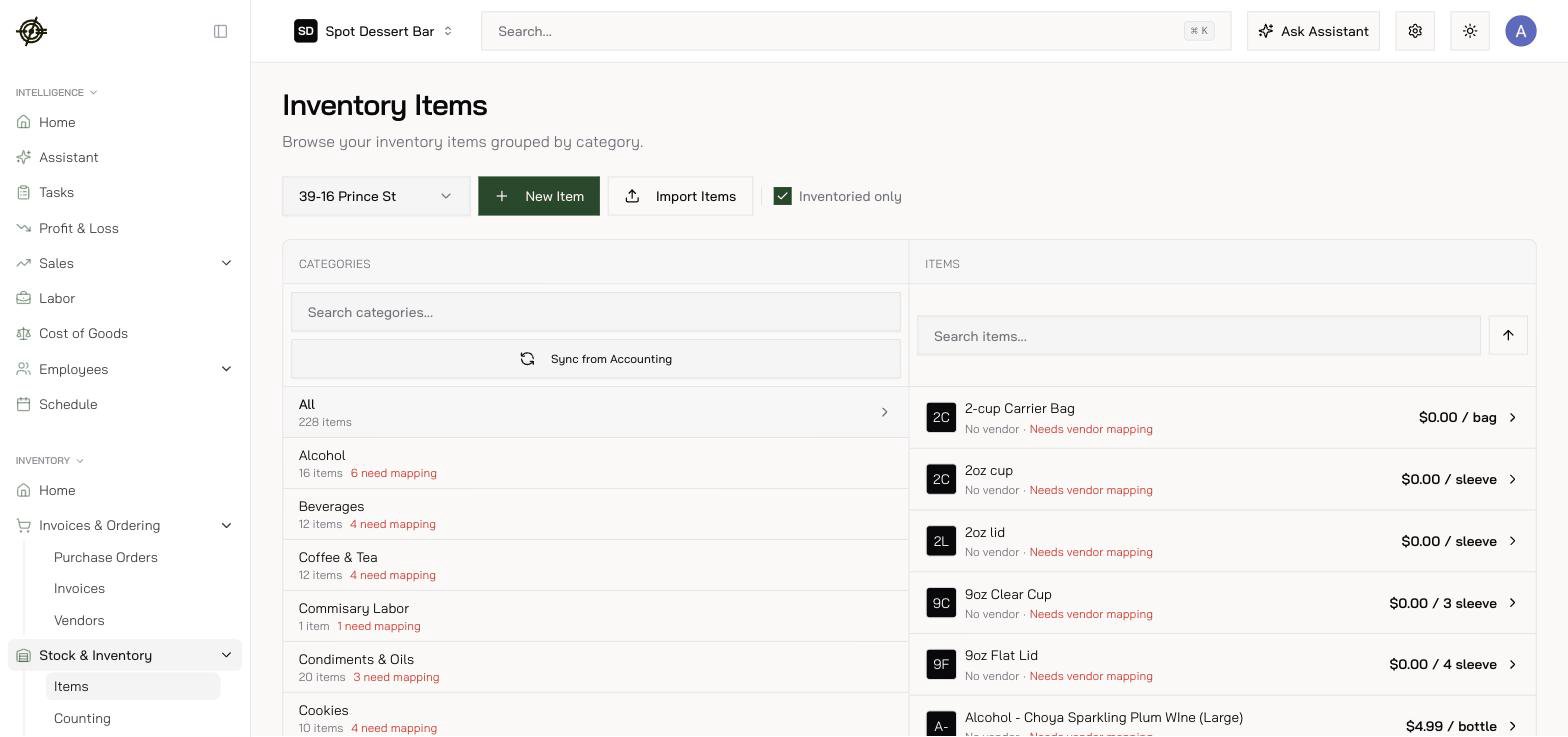 * Keep units and conversions clean; a case-vs-each mixup poisons every count after it.
* Red **Needs vendor mapping** labels mean the item isn't tied to what you actually buy. Those items can't price themselves. Clear them.
* **Sync from Accounting** pulls categories from your chart of accounts so COGS lands in the right buckets.
2. **Vendors**: one record per real vendor. Merge the duplicates ("Sysco" and "SYSCO Inc" are the same company).
3. **Recipes**: build recipes from items so every menu item has a cost.
* Keep units and conversions clean; a case-vs-each mixup poisons every count after it.
* Red **Needs vendor mapping** labels mean the item isn't tied to what you actually buy. Those items can't price themselves. Clear them.
* **Sync from Accounting** pulls categories from your chart of accounts so COGS lands in the right buckets.
2. **Vendors**: one record per real vendor. Merge the duplicates ("Sysco" and "SYSCO Inc" are the same company).
3. **Recipes**: build recipes from items so every menu item has a cost.
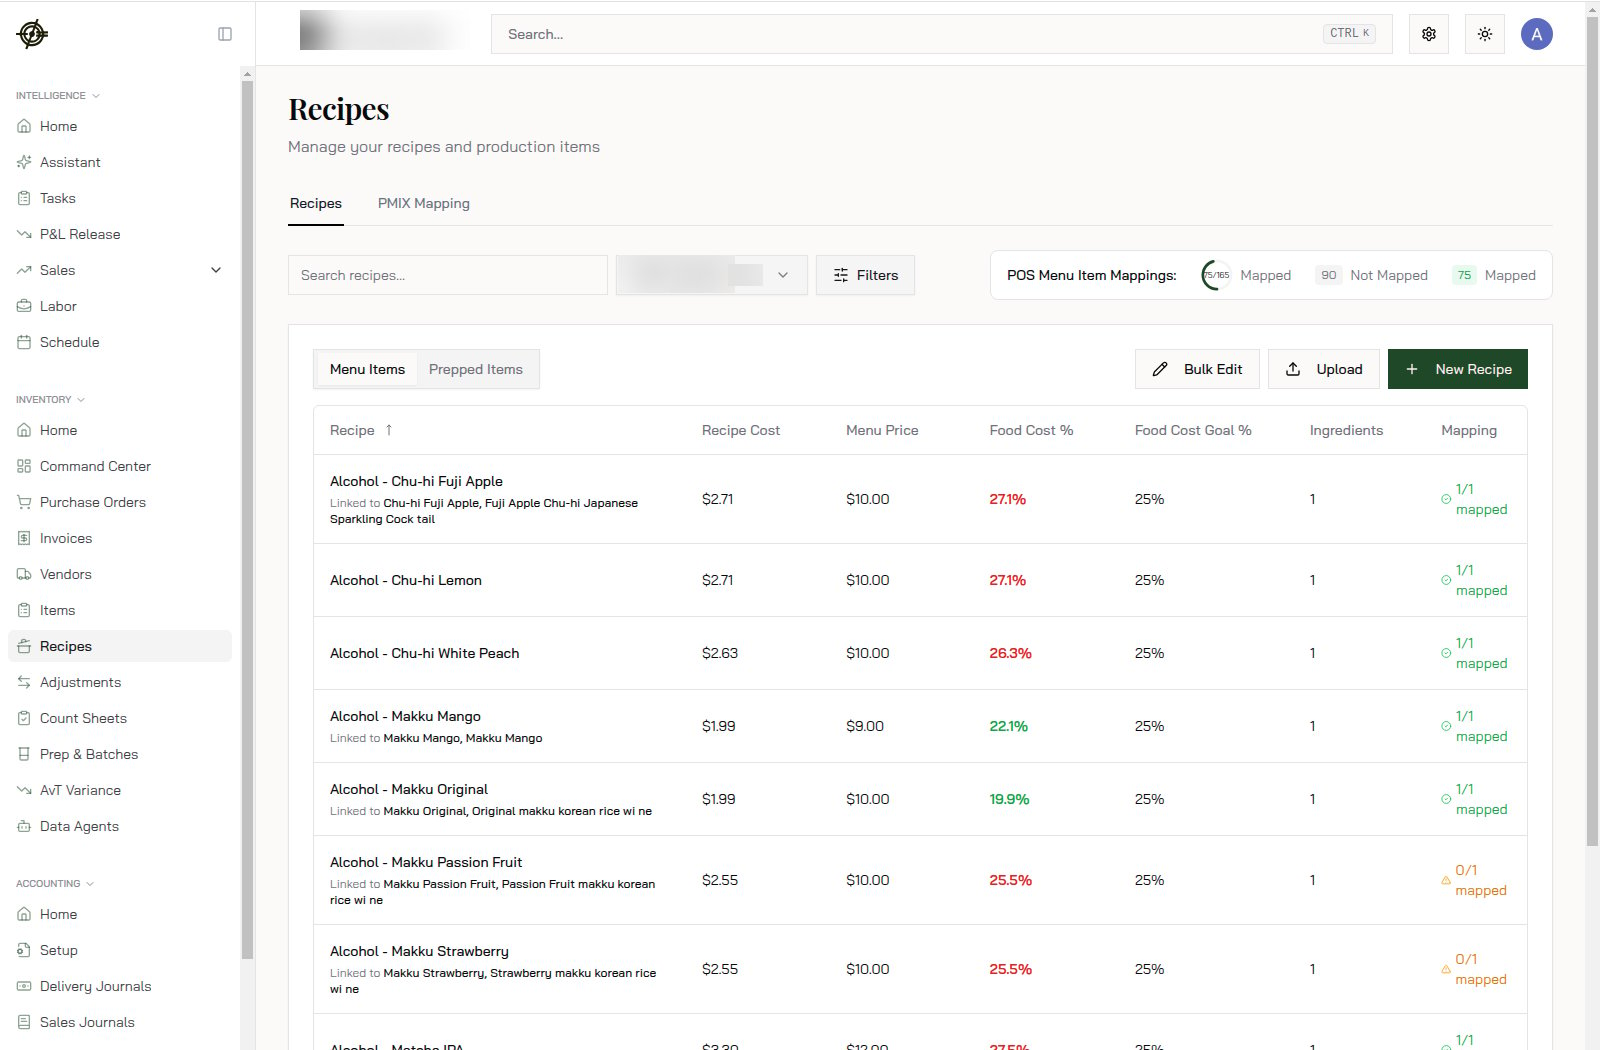 * Each row shows recipe cost, menu price, food cost %, and your goal. A $2.71 cocktail selling at $10 is 27.1% against a 25% goal: red, but one price change away from green.
* The **Mapping** column ties recipes to POS menu items. Unmapped recipes (0/1) don't count toward theoretical usage, which silently corrupts [AvT variance](#compare-avt-variance). The mapping counter at the top shows how much is left.
* Use **PMIX Mapping** to bulk-map POS items, and **Prepped Items** for batch recipes (sauces, doughs) that other recipes use as ingredients.
## Buy
### Purchase orders
1. Open **Purchase Orders** and create one per vendor.
2. Add items and quantities, review, send.
3. Approve orders that staff placed from the app.
### Invoices
* Each row shows recipe cost, menu price, food cost %, and your goal. A $2.71 cocktail selling at $10 is 27.1% against a 25% goal: red, but one price change away from green.
* The **Mapping** column ties recipes to POS menu items. Unmapped recipes (0/1) don't count toward theoretical usage, which silently corrupts [AvT variance](#compare-avt-variance). The mapping counter at the top shows how much is left.
* Use **PMIX Mapping** to bulk-map POS items, and **Prepped Items** for batch recipes (sauces, doughs) that other recipes use as ingredients.
## Buy
### Purchase orders
1. Open **Purchase Orders** and create one per vendor.
2. Add items and quantities, review, send.
3. Approve orders that staff placed from the app.
### Invoices
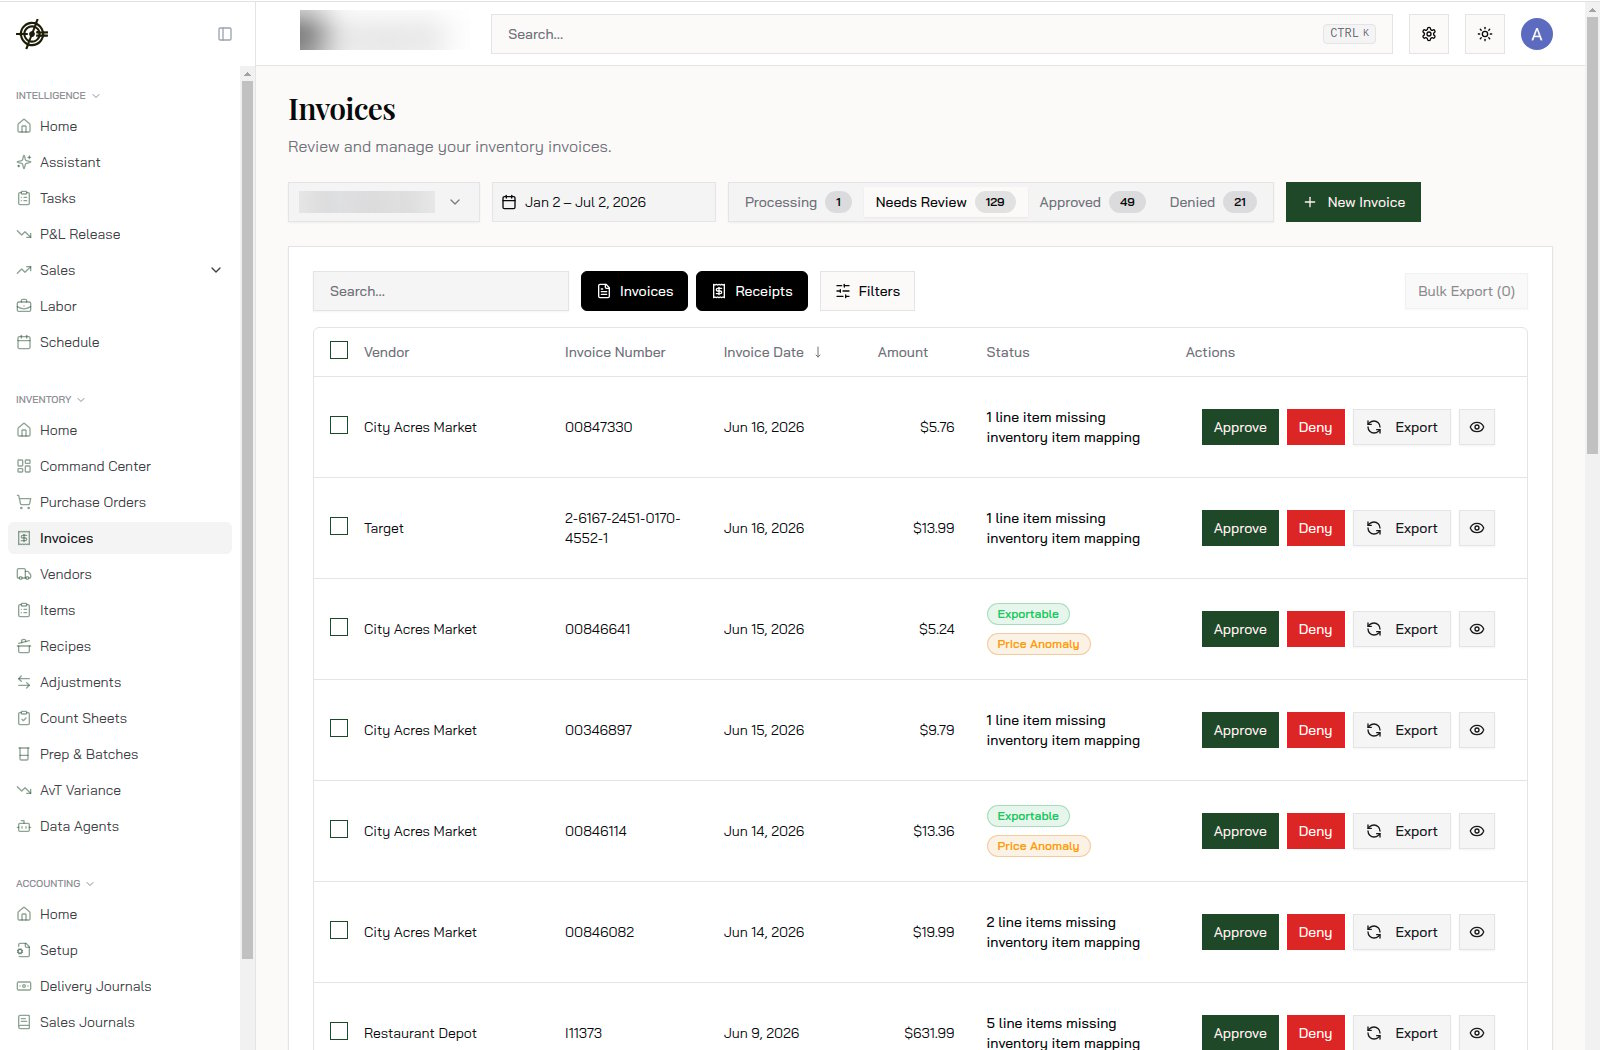 1. Upload the invoice (photo or file, here or from the app). Parsing reads the vendor, lines, and prices.
2. Work the **Needs Review** tab. Each row tells you exactly what's wrong: "1 line item missing inventory item mapping", or a **Price Anomaly** badge when a price jumped.
3. Open the invoice to fix it. The detail view shows the receipt image next to the parsed lines.
1. Upload the invoice (photo or file, here or from the app). Parsing reads the vendor, lines, and prices.
2. Work the **Needs Review** tab. Each row tells you exactly what's wrong: "1 line item missing inventory item mapping", or a **Price Anomaly** badge when a price jumped.
3. Open the invoice to fix it. The detail view shows the receipt image next to the parsed lines.
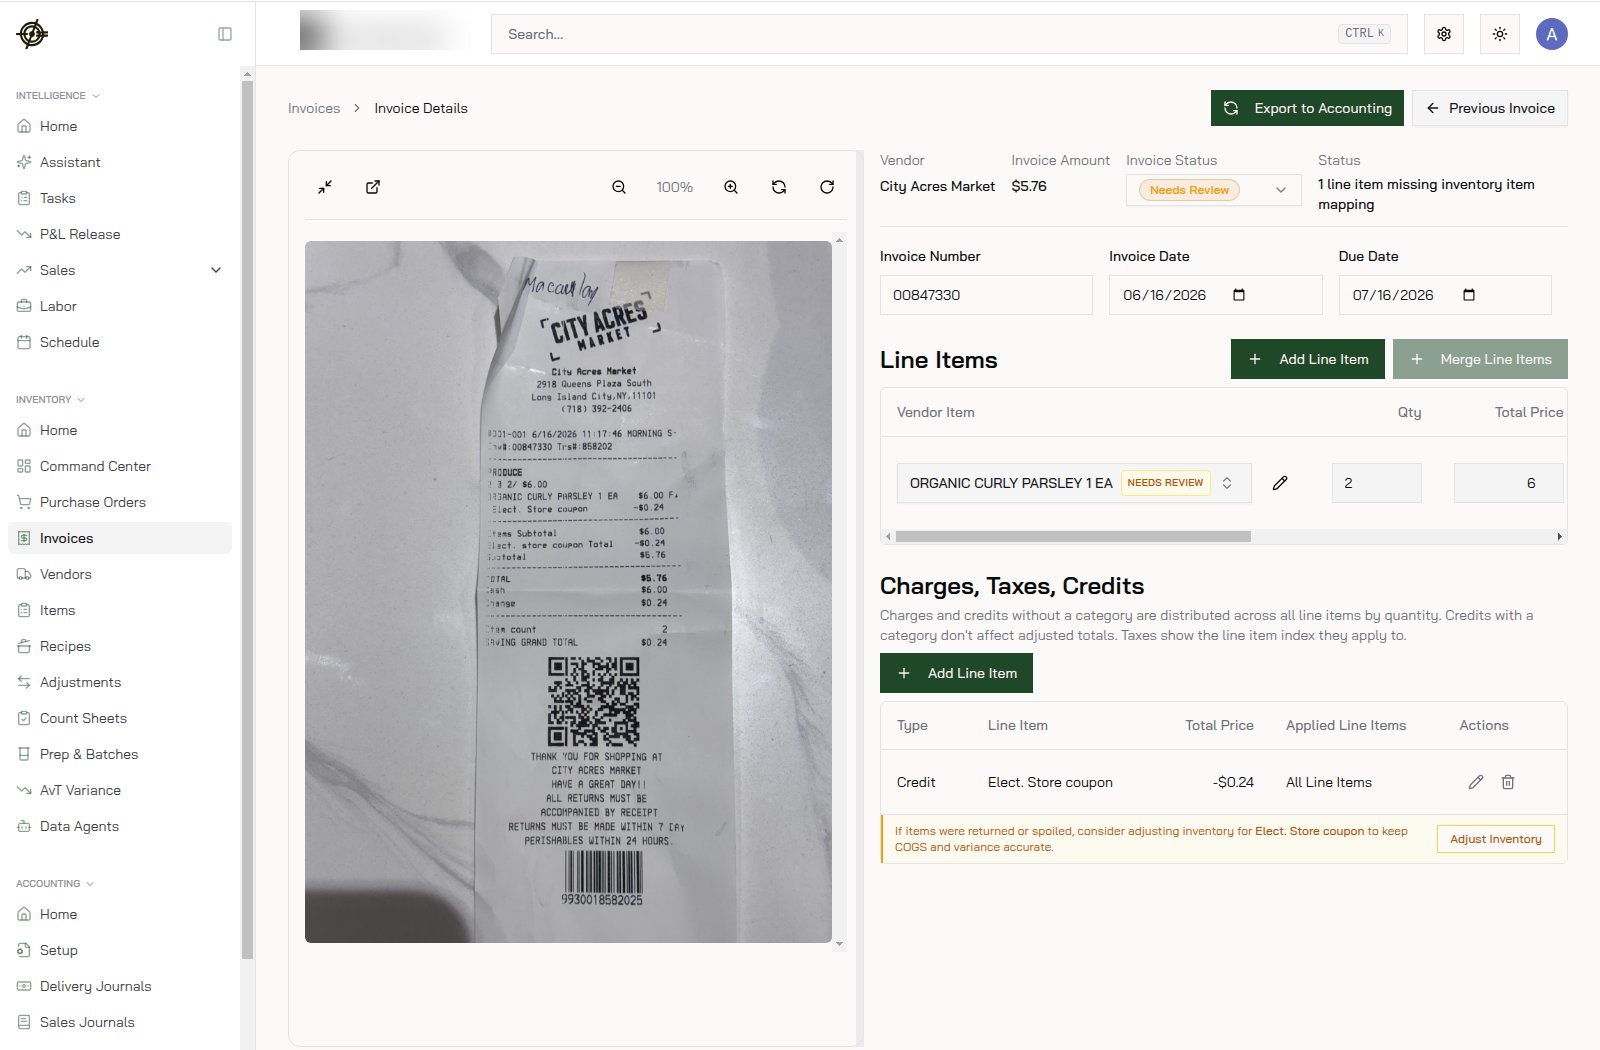 * Map any unmapped line to an inventory item, fix quantities, and check taxes, credits, and extra charges.
* Returned or spoiled goods? Use **Adjust Inventory** right from the invoice so COGS and variance stay accurate.
4. **Approve** or **Deny**. Approved invoices flow to [accounting](/accounting/overview) and update item prices.
Approve invoices same-day. Every approved invoice updates item prices, which keeps recipe costs and COGS honest. A price creep of 30 cents per case is invisible on paper and obvious here.
## Count
* Map any unmapped line to an inventory item, fix quantities, and check taxes, credits, and extra charges.
* Returned or spoiled goods? Use **Adjust Inventory** right from the invoice so COGS and variance stay accurate.
4. **Approve** or **Deny**. Approved invoices flow to [accounting](/accounting/overview) and update item prices.
Approve invoices same-day. Every approved invoice updates item prices, which keeps recipe costs and COGS honest. A price creep of 30 cents per case is invisible on paper and obvious here.
## Count
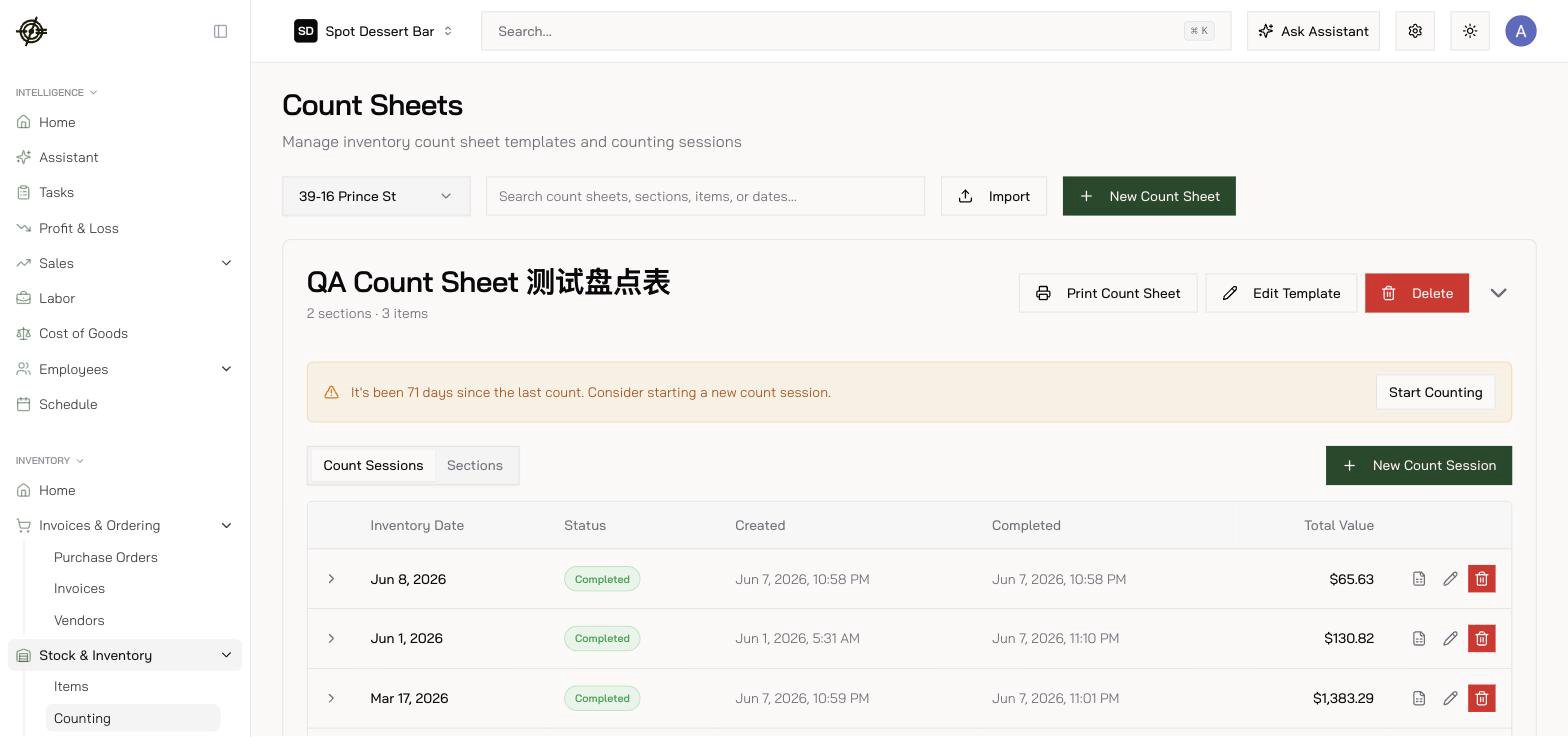 1. Build **Count Sheets** organized the way you walk the store (walk-in, dry storage, line). This store's sheet: 18 sections, 203 items.
2. Run counts on a fixed schedule. Weekly for most spots; don't skip weeks. Each completed session shows its total value, so a $105,140.79 count after a $12,153.12 count tells you instantly something's off (usually units).
3. Record waste, transfers, refunds, and prep use under **Adjustments** as they happen, not at month-end from memory.
4. Track prepped items and batches under **Prep & Batches** so prep isn't a black hole in the count.
## Compare: AvT Variance
**AvT Variance** compares actual usage (from counts and invoices) against theoretical usage (from recipes and sales). It's the report that tells you where food cost is leaking.
1. Build **Count Sheets** organized the way you walk the store (walk-in, dry storage, line). This store's sheet: 18 sections, 203 items.
2. Run counts on a fixed schedule. Weekly for most spots; don't skip weeks. Each completed session shows its total value, so a $105,140.79 count after a $12,153.12 count tells you instantly something's off (usually units).
3. Record waste, transfers, refunds, and prep use under **Adjustments** as they happen, not at month-end from memory.
4. Track prepped items and batches under **Prep & Batches** so prep isn't a black hole in the count.
## Compare: AvT Variance
**AvT Variance** compares actual usage (from counts and invoices) against theoretical usage (from recipes and sales). It's the report that tells you where food cost is leaking.
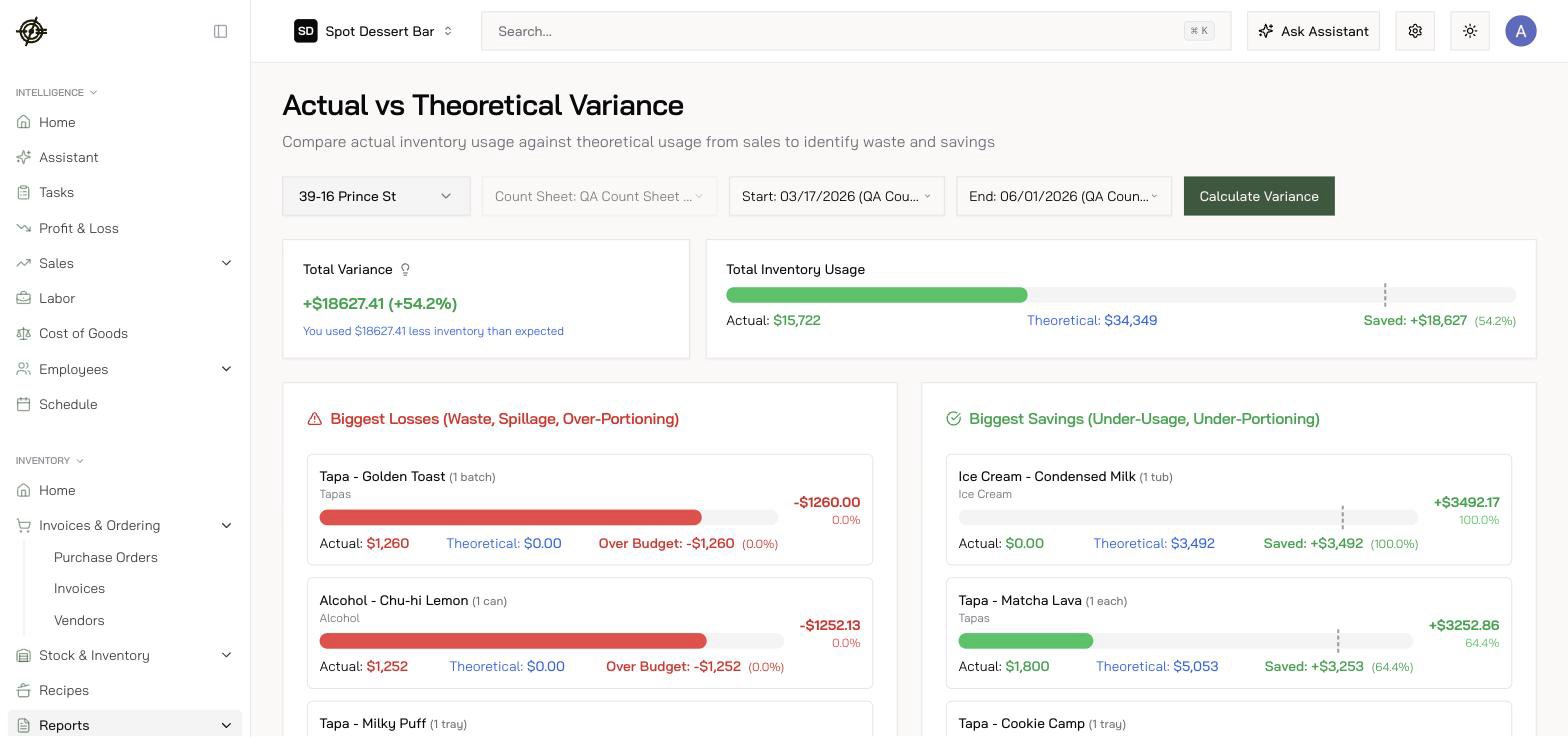 1. Pick the location, the start and end count sessions, and hit **Calculate Variance**.
2. Read **Biggest Losses** first: waste, spillage, over-portioning. Jasmine Tea with $1,650 actual usage and $0 theoretical means it's being used but no recipe accounts for it. That's a mapping fix, not theft.
3. **Biggest Savings** items (actual far under theoretical) are usually recipe errors in the other direction: the recipe claims more than the kitchen uses.
Rules for reading it:
* Chase the top 5 variance items each week. Ignore the noise below them.
* An item at 0.0% theoretical is always a recipe or mapping gap. Fix the data before accusing the kitchen.
* Variance on everything? Your counts or units are broken. Fix the foundation first.
* A totals number like +325% means the data isn't trustworthy yet. Clean mappings, then re-run.
## Let the agents help
**Data Agents** are AI-assisted workflows for the grunt work: vendor matching, item cleanup, and data fixes. Use them before doing anything by hand at scale.
## The weekly rhythm
* Daily: invoices approved same-day.
* Weekly: count, then Command Center, then AvT variance on the top items.
* After each count: [export the inventory journal](/accounting/overview).
* Always: keep the Action Items list on Inventory Home near zero.
1. Pick the location, the start and end count sessions, and hit **Calculate Variance**.
2. Read **Biggest Losses** first: waste, spillage, over-portioning. Jasmine Tea with $1,650 actual usage and $0 theoretical means it's being used but no recipe accounts for it. That's a mapping fix, not theft.
3. **Biggest Savings** items (actual far under theoretical) are usually recipe errors in the other direction: the recipe claims more than the kitchen uses.
Rules for reading it:
* Chase the top 5 variance items each week. Ignore the noise below them.
* An item at 0.0% theoretical is always a recipe or mapping gap. Fix the data before accusing the kitchen.
* Variance on everything? Your counts or units are broken. Fix the foundation first.
* A totals number like +325% means the data isn't trustworthy yet. Clean mappings, then re-run.
## Let the agents help
**Data Agents** are AI-assisted workflows for the grunt work: vendor matching, item cleanup, and data fixes. Use them before doing anything by hand at scale.
## The weekly rhythm
* Daily: invoices approved same-day.
* Weekly: count, then Command Center, then AvT variance on the top items.
* After each count: [export the inventory journal](/accounting/overview).
* Always: keep the Action Items list on Inventory Home near zero.