> ## Documentation Index
> Fetch the complete documentation index at: https://guide.garde.app/llms.txt
> Use this file to discover all available pages before exploring further.
# P&L and investor reports
> Review, release, and share profit and loss reporting.
Your P\&L used to arrive weeks after the month ended, when the damage was already done. Here, journals post daily and the P\&L is reviewable within days. Review it while you can still act on it.
Two audiences, two tools:
* **P\&L Release**: for finance users preparing and publishing the P\&L.
* **Investor**: a clean, read-only view for owners and investors.
## The release list
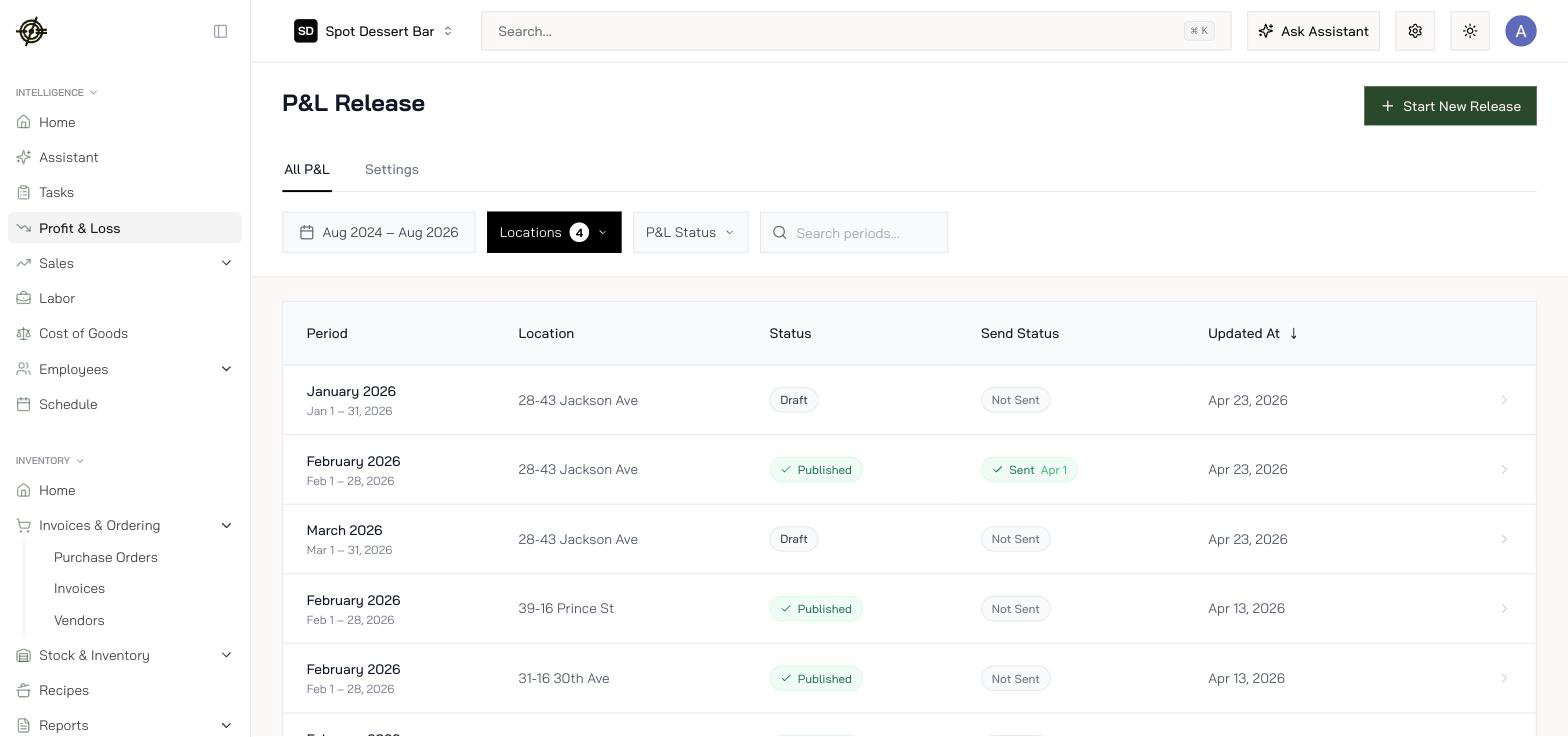 Open **P\&L Release** in the sidebar. Each row is one period at one location, with two statuses:
* **Draft / Published**: whether the report is finalized.
* **Send Status**: whether it's been sent to its recipients.
Filter by location, period, or status. Drafts sitting for months (a January draft last touched in May) are the rows to clean up.
## Release a P\&L
1. Hit **Start New Release**, or open an existing draft.
2. Pick the reporting period and location.
3. Open the report and review it section by section.
Open **P\&L Release** in the sidebar. Each row is one period at one location, with two statuses:
* **Draft / Published**: whether the report is finalized.
* **Send Status**: whether it's been sent to its recipients.
Filter by location, period, or status. Drafts sitting for months (a January draft last touched in May) are the rows to clean up.
## Release a P\&L
1. Hit **Start New Release**, or open an existing draft.
2. Pick the reporting period and location.
3. Open the report and review it section by section.
 Inside the report:
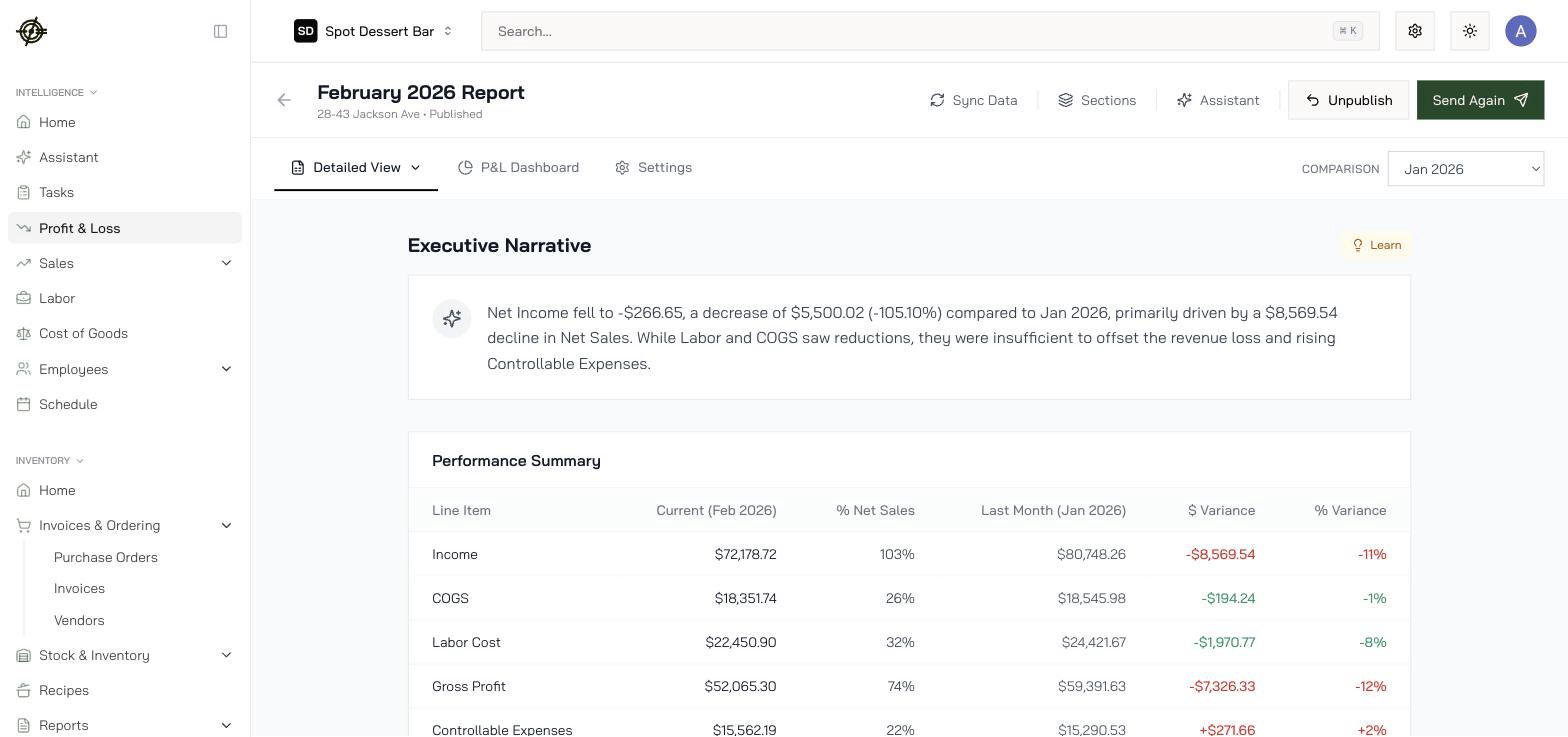
* **Executive Narrative** is written for you from the numbers: "Net Income fell to -$266.65, a decrease of $5,500.02 (-105.10%) compared to Jan 2026, primarily driven by a \$8,569.54 decline in Net Sales." Read it first; it tells you where to look.
* **Performance Summary** is the P\&L itself: Income, COGS, Labor, Gross Profit, Controllable Expenses, Fixed Expenses, Net Operating Income. Toggle between \$ and % of net sales, and change the **Comparison** period in the top right.
* Each section (Revenue Analysis, and the rest) gets its own AI summary under it.
* **Sync Data** re-pulls the latest journals into the draft. Use it after fixing anything upstream.
4. Fix upstream problems before releasing. Wrong COGS usually means a [count](/dashboard/inventory) or invoice issue, not a P\&L issue. Sync, re-check, then publish.
5. **Publish**, then send it to recipients. **Send Again** re-delivers; **Unpublish** pulls it back if you caught something late.
Configure recipients and report behavior under **P\&L Release → Settings**.
## The investor view
**Investor** and **Investor → P\&L Reports** show profitability by location and period without any operational tooling around it. Send investors and partners here. They get the numbers; they don't get your vendor list.
## Know-how
* % of Net Sales is the column to read. Labor at 31.88% and COGS at 26.06% are comparable month to month even when sales swing.
* A published month is a locked story. If numbers must change after publishing, unpublish, sync, re-review, re-publish. Don't let a stale published report circulate.
* Reviewing takes minutes when the month was maintained: invoices approved same-day, counts done, journals exported. A painful P\&L review is a symptom, not the disease.
Inside the report:
* **Executive Narrative** is written for you from the numbers: "Net Income fell to -$266.65, a decrease of $5,500.02 (-105.10%) compared to Jan 2026, primarily driven by a \$8,569.54 decline in Net Sales." Read it first; it tells you where to look.
* **Performance Summary** is the P\&L itself: Income, COGS, Labor, Gross Profit, Controllable Expenses, Fixed Expenses, Net Operating Income. Toggle between \$ and % of net sales, and change the **Comparison** period in the top right.
* Each section (Revenue Analysis, and the rest) gets its own AI summary under it.
* **Sync Data** re-pulls the latest journals into the draft. Use it after fixing anything upstream.
4. Fix upstream problems before releasing. Wrong COGS usually means a [count](/dashboard/inventory) or invoice issue, not a P\&L issue. Sync, re-check, then publish.
5. **Publish**, then send it to recipients. **Send Again** re-delivers; **Unpublish** pulls it back if you caught something late.
Configure recipients and report behavior under **P\&L Release → Settings**.
## The investor view
**Investor** and **Investor → P\&L Reports** show profitability by location and period without any operational tooling around it. Send investors and partners here. They get the numbers; they don't get your vendor list.
## Know-how
* % of Net Sales is the column to read. Labor at 31.88% and COGS at 26.06% are comparable month to month even when sales swing.
* A published month is a locked story. If numbers must change after publishing, unpublish, sync, re-review, re-publish. Don't let a stale published report circulate.
* Reviewing takes minutes when the month was maintained: invoices approved same-day, counts done, journals exported. A painful P\&L review is a symptom, not the disease.