> ## Documentation Index
> Fetch the complete documentation index at: https://guide.garde.app/llms.txt
> Use this file to discover all available pages before exploring further.
# AvT variance: find your missing margin
> Actual vs theoretical usage — waste, over-portioning, theft, or data problems, quantified.
**Who:** owner or chef — whoever answers for food cost.
**When:** right after each monthly count, while memories are fresh.
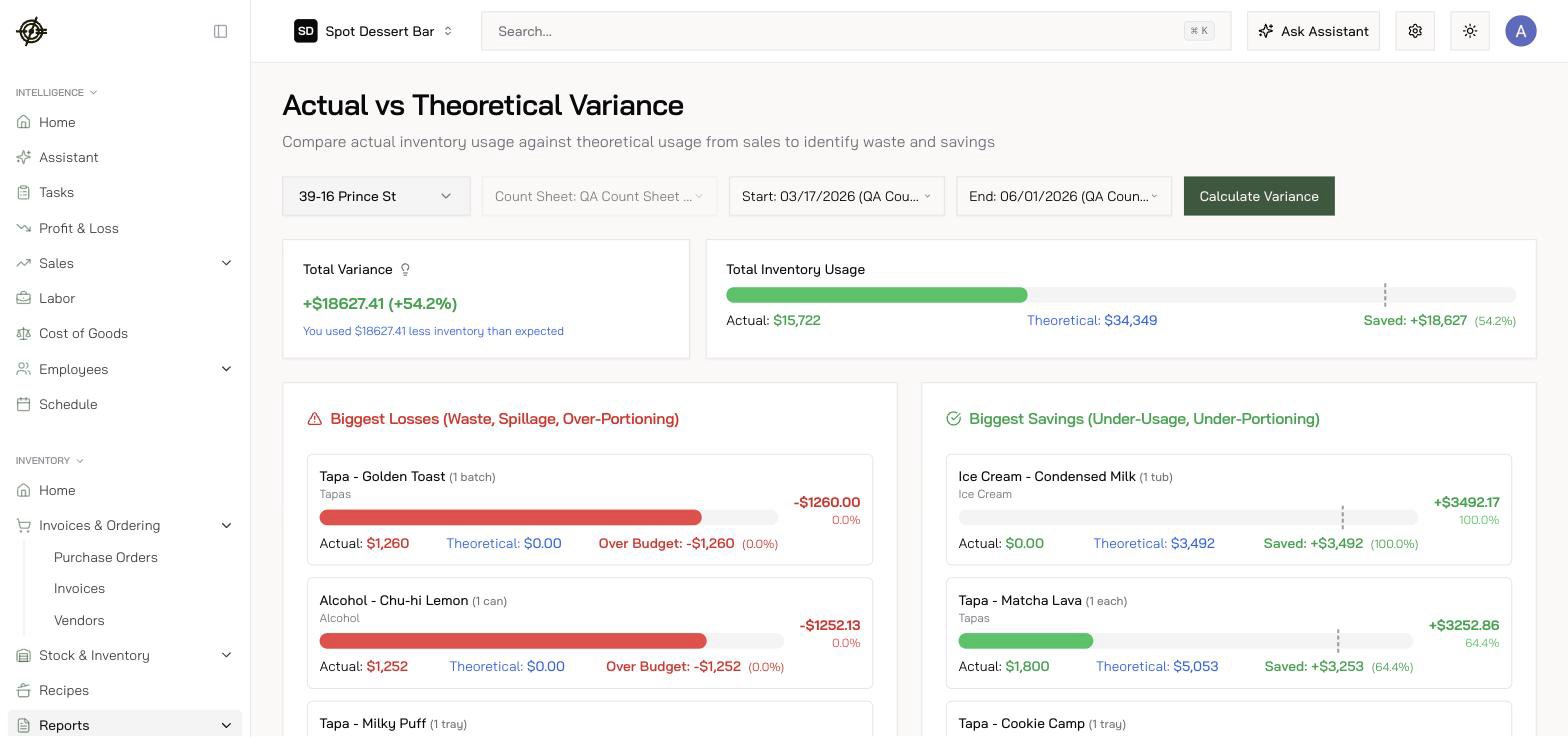
AvT compares what you *actually* used (counts + purchases) with what you *should* have used (recipes × sales). The gap is your missing margin.
## Run the report
1. Go to **Inventory → Reports → AvT Variance**.
2. Pick the **count sheet**, then a **Start Count Date** and **End Count Date** — you need at least two completed counts.
3. **Calculate Variance**.
 ## Read it
* **Total Variance** — negative means you used more than expected (losses); positive means less (savings).
* **Biggest Losses** — waste, spillage, over-portioning candidates. The top three lines usually explain most of the gap.
* **Biggest Savings** — sustained "savings" on an item often means the recipe overstates quantities. Fix the recipe.
* **Breakdown by Category** — per-item actual vs theoretical, in dollars and percent.
**If a number looks absurd** (10× or 1000× off), it's data, not theft: a wrong unit conversion, a duplicate item, or unmapped sales. See [Items, units & count sizes](/operating-guide/setup-items-units) — fix the data, then re-read the report.
## Read it
* **Total Variance** — negative means you used more than expected (losses); positive means less (savings).
* **Biggest Losses** — waste, spillage, over-portioning candidates. The top three lines usually explain most of the gap.
* **Biggest Savings** — sustained "savings" on an item often means the recipe overstates quantities. Fix the recipe.
* **Breakdown by Category** — per-item actual vs theoretical, in dollars and percent.
**If a number looks absurd** (10× or 1000× off), it's data, not theft: a wrong unit conversion, a duplicate item, or unmapped sales. See [Items, units & count sizes](/operating-guide/setup-items-units) — fix the data, then re-read the report.