> ## Documentation Index
> Fetch the complete documentation index at: https://guide.garde.app/llms.txt
> Use this file to discover all available pages before exploring further.
# The weekly review
> Four pages, fifteen minutes — sales, labor, and cost of goods with last week complete.
**Who:** owner and GM, together if you can.
**When:** the same time every week. Monday morning works.
## 1. Home — the weekly report
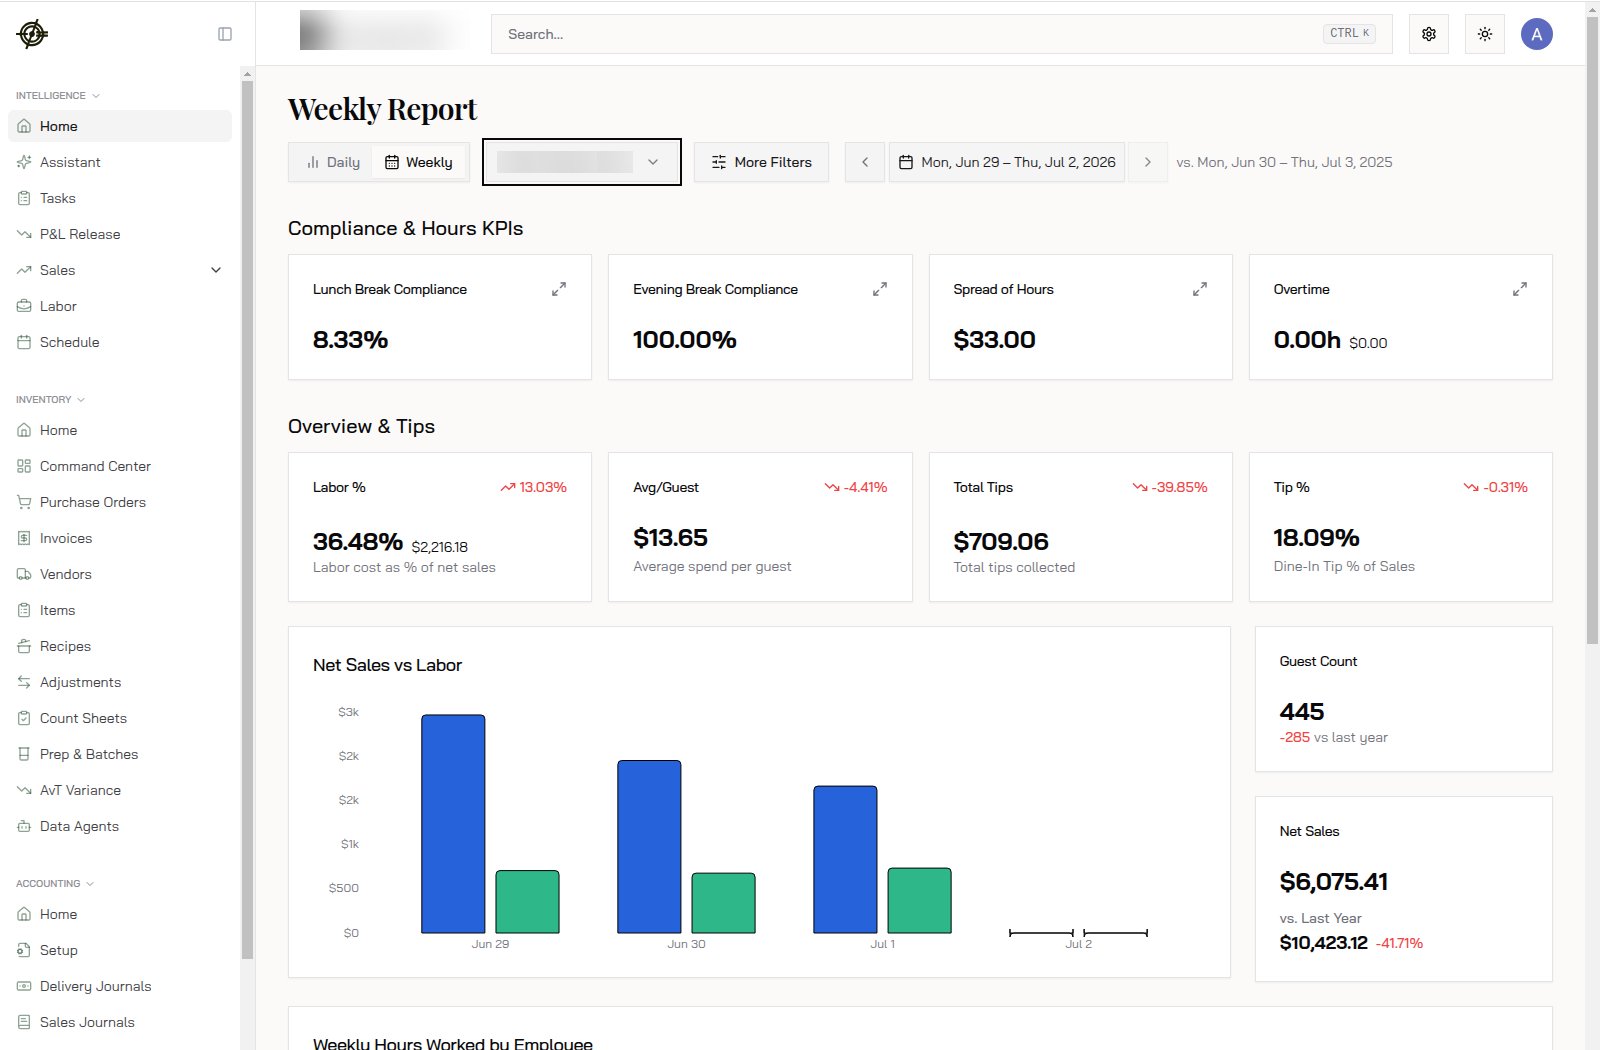
**Home** is the manager report: Net Sales vs last year, **Labor %**, **Avg/Guest**, **Guest Count**, **Total Tips**, plus **Compliance & Hours KPIs** — break compliance, **Spread of Hours**, **Overtime**, and who's *approaching* overtime before it costs you. Flip **Daily/Weekly** tabs; skim **Shifts Review**.
 ## 2. Sales
**Sales → Overview**: net sales over time, **By Day of Week Averages**, **By Hour Averages** (filter lunch/dinner). Staff to when the money actually shows up.
## 2. Sales
**Sales → Overview**: net sales over time, **By Day of Week Averages**, **By Hour Averages** (filter lunch/dinner). Staff to when the money actually shows up.
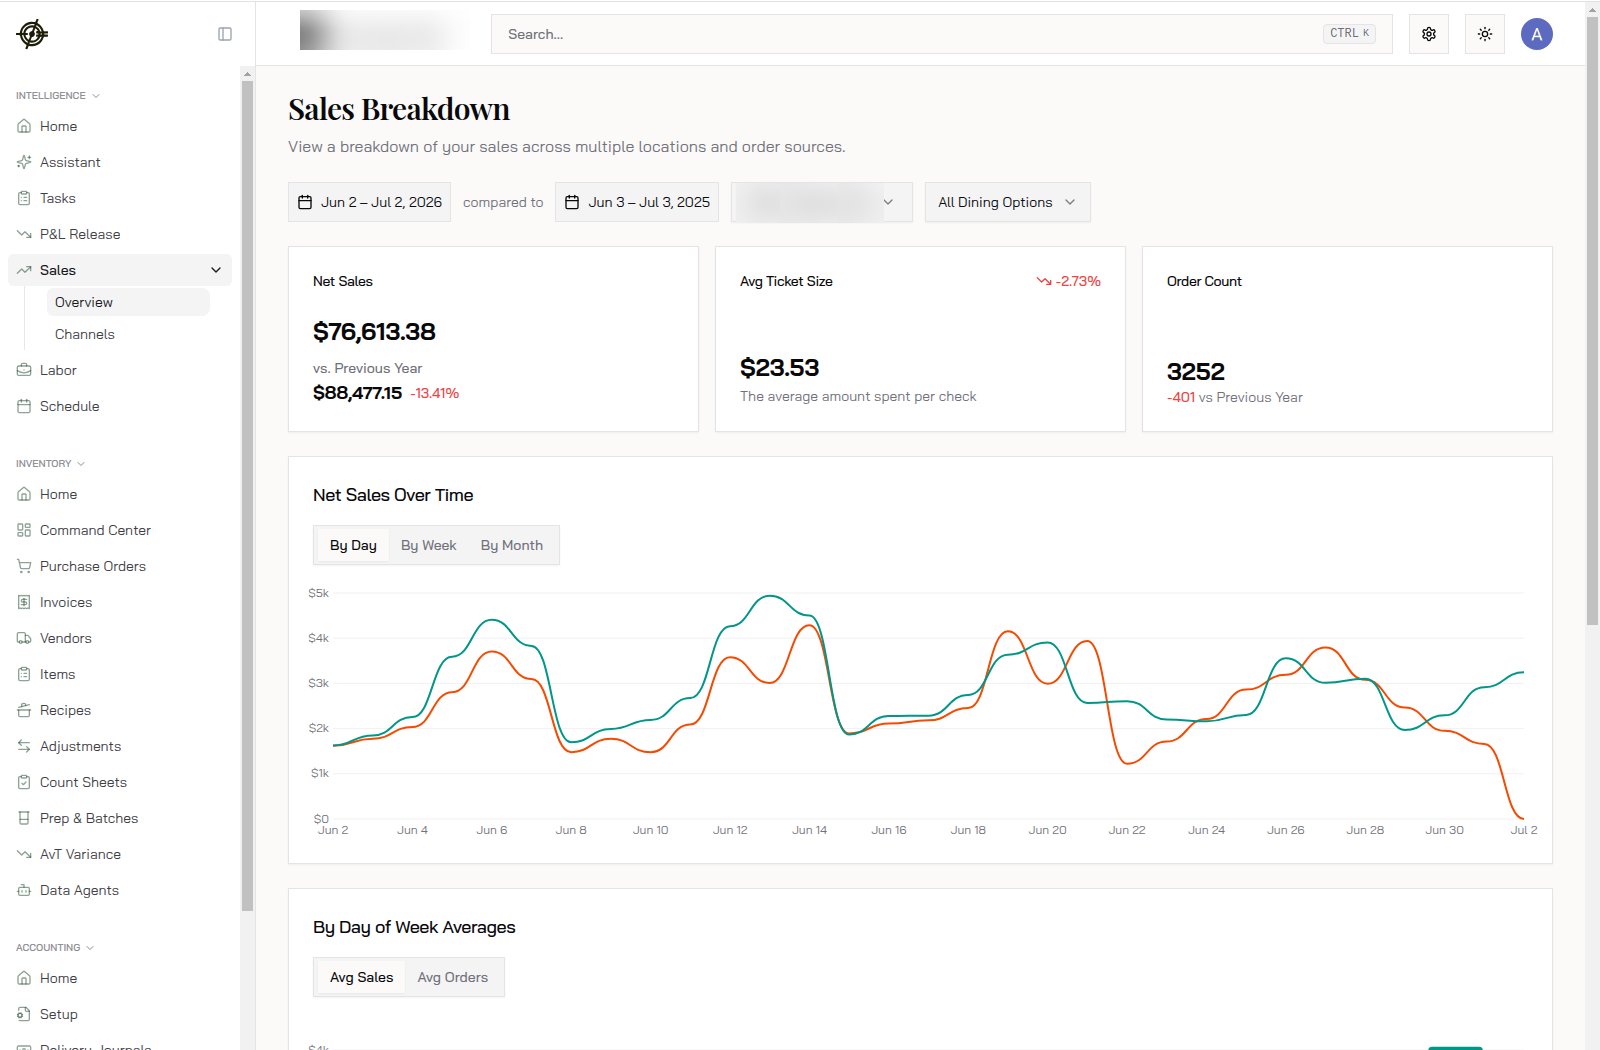 **Sales → Channels** splits **Dine In / Takeout / Delivery** and ranks **Third Party Platform Sales** — the fee conversation starts here.
## 3. Labor
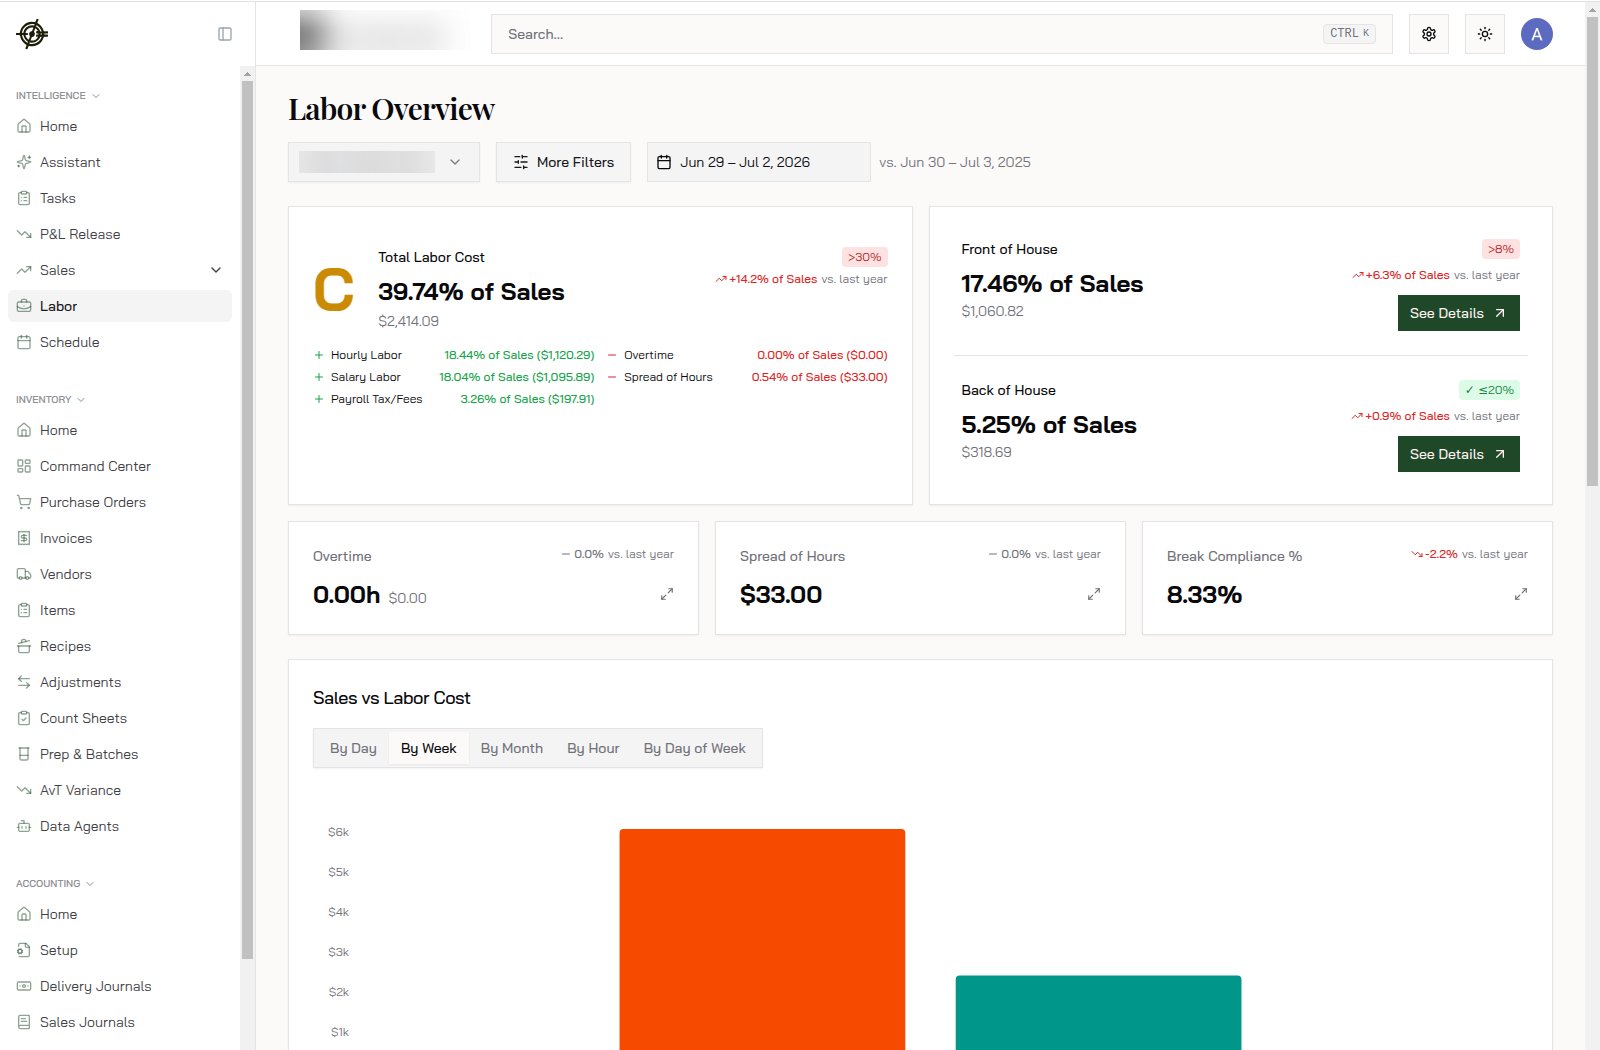
**Labor** splits **Front of House / Back of House / Controllable / Total**, each as % of sales against thresholds, with a **Role Breakdown (by spending)** and drill-in compliance violations. **Average Ticket Time vs. Back of House Staffing** answers whether extra kitchen hands actually speed up tickets.
**Sales → Channels** splits **Dine In / Takeout / Delivery** and ranks **Third Party Platform Sales** — the fee conversation starts here.
## 3. Labor
**Labor** splits **Front of House / Back of House / Controllable / Total**, each as % of sales against thresholds, with a **Role Breakdown (by spending)** and drill-in compliance violations. **Average Ticket Time vs. Back of House Staffing** answers whether extra kitchen hands actually speed up tickets.
 ## 4. Cost of Goods
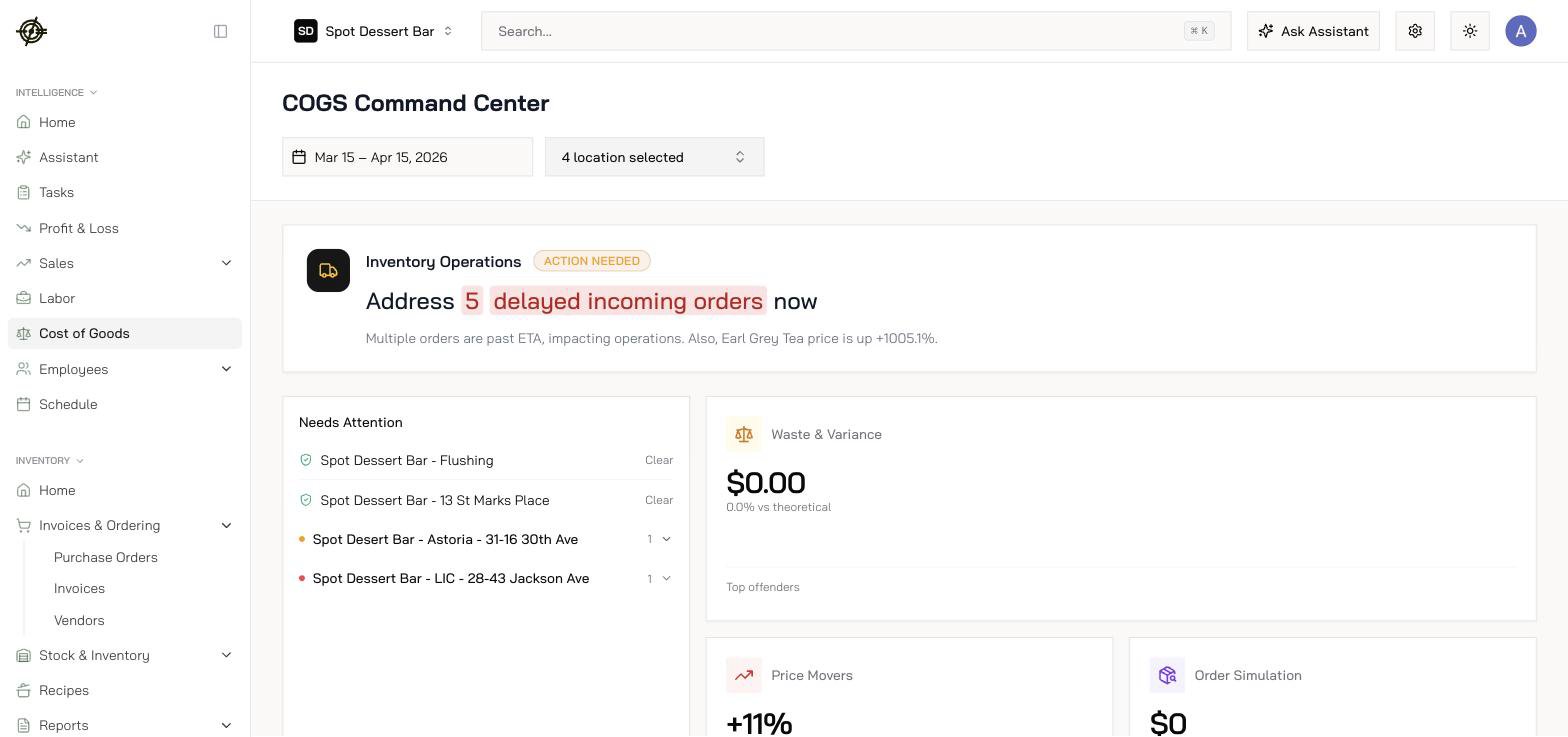
**Cost of Goods** is the inventory command center: **Waste & Variance**, **Price Movers**, **Order Simulation**, **Incoming Orders**, **Inventory Turns**, **Cost / Margin**, **Fill Rate & Shorts**, **Batch Forecast & Simulate**, **Demand Velocity** — one screen for "where is my food money going this week?"
## 4. Cost of Goods
**Cost of Goods** is the inventory command center: **Waste & Variance**, **Price Movers**, **Order Simulation**, **Incoming Orders**, **Inventory Turns**, **Cost / Margin**, **Fill Rate & Shorts**, **Batch Forecast & Simulate**, **Demand Velocity** — one screen for "where is my food money going this week?"
 **The weekly questions:** Did sales beat last year? Is labor % inside target? Which price moved most — did anyone act on it? What's the biggest unexplained variance?