

Read the top card
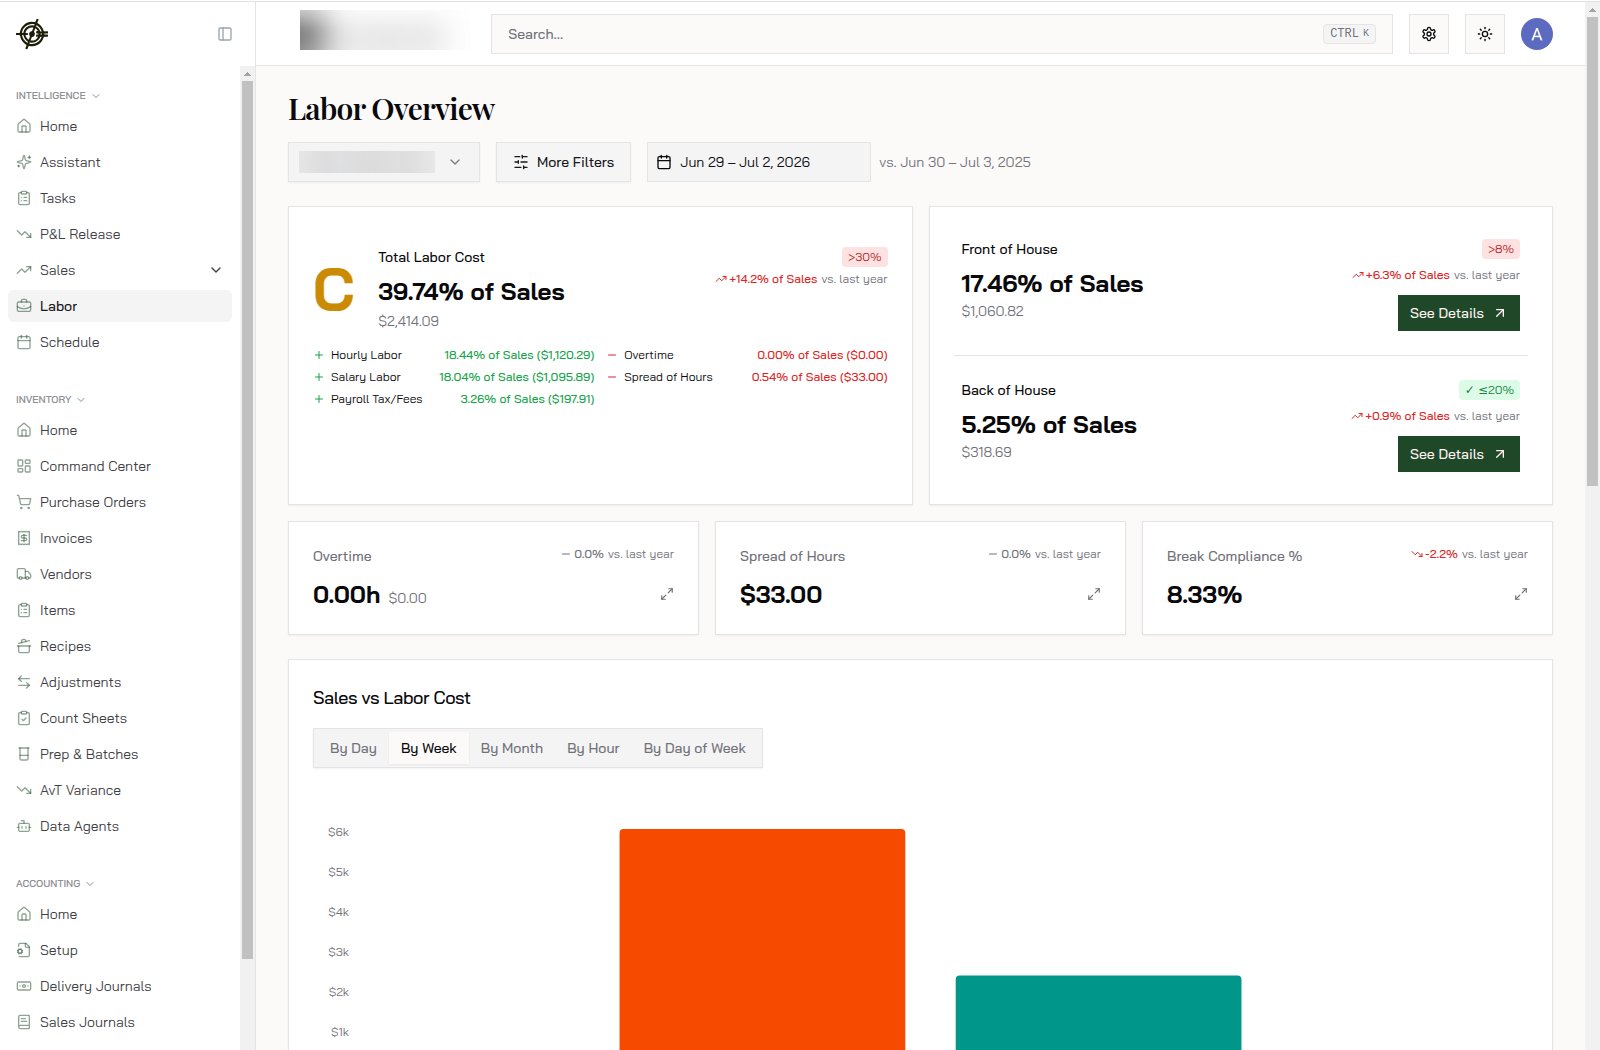
The big number is Total Labor Cost as a percent of sales, with a letter grade next to it. This store: 39.74% of sales ($2,414.09), graded C, flagged red because it’s over the 30% threshold. The card breaks it down:- Hourly Labor: 18.44% of sales ($1,120.29). The part the schedule controls.
- Salary Labor: 18.04% ($1,095.89). Fixed. When sales dip, this percent balloons even though nothing changed. Know which half is moving before you panic.
- Payroll Tax/Fees: 3.26% ($197.91). Rides along with wages.
- Overtime and Spread of Hours are broken out on the right so premium pay never hides inside the total.
FOH vs. BOH
The right-hand cards split Front of House (17.46% of sales) and Back of House (5.25%), each with its own threshold and a See Details drill-down to the people and shifts behind the number. This split only works if roles are mapped to departments; set that under Payroll.Kill overtime early
The overtime view lists the exact shifts driving overtime, by person.- Open it midweek, not after payroll.
- Find who’s already trending toward overtime.
- Fix the schedule for the back half of the week.
Compliance
Two cards to take seriously:- Break Compliance %: the share of shifts where required breaks were actually taken. 8.33% is not a rounding problem; it’s systematic. Fix the floor habit, not the report.
- Spread of Hours: premium pay owed when a workday spans too long (NY rule). $33.00 this week is small; the point is you see it accrue instead of discovering it in an audit.
Sales vs. Labor chart
The bottom chart plots sales against labor cost, toggled By Day / By Week / By Month / By Hour / By Day of Week. The by-hour view next to your by-hour sales is how you find the leak: four people on for a $100 hour.The weekly habit
- Wednesday: open Labor, check the overtime table, adjust the back half of the week.
- Monday: review last week’s labor %, FOH/BOH split, and compliance.
- Labor % up? Check whether sales dropped or hours grew. Different problems, different fixes.
Know-how
- The comparison (“vs. last year”) uses the same dates a year earlier. The +14.2% of sales badge means labor as a share of sales grew that much, not dollars.
- Grades and thresholds (>30% red, ≤20% green for BOH) are targets to react to, not decoration. Chronic red is a schedule structure problem: too many opening hours for the volume.
- Salaried managers make small-sales weeks look terrible. Judge hourly labor % week to week; judge total labor % monthly.
- Numbers missing for someone? Their POS profile probably isn’t linked. Check Employee Mappings under Settings.