

Run the report
- Go to Inventory → Reports → AvT Variance.
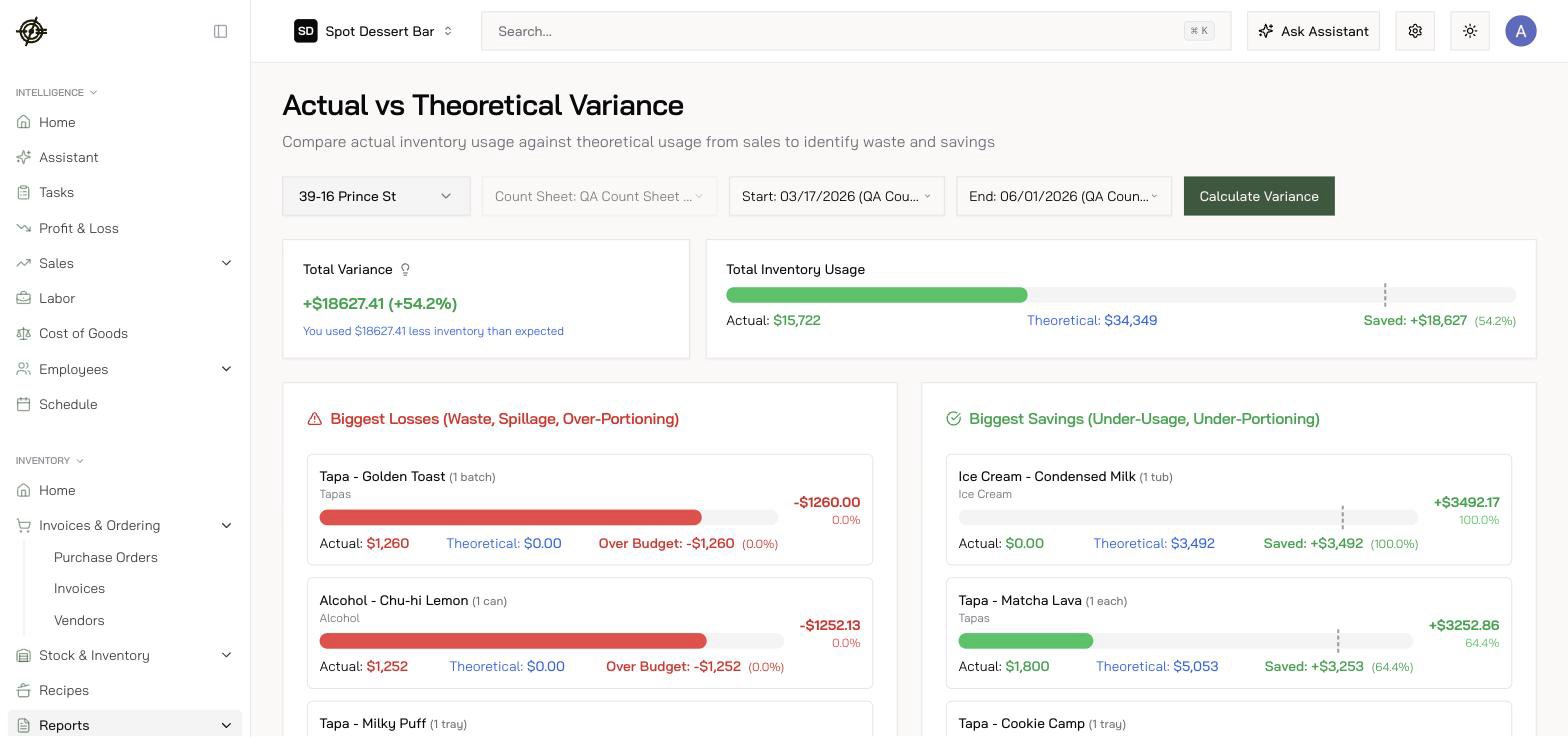
- Pick the Count Sheet, then a Start Count Date and End Count Date — you need at least two completed counts.
- Calculate Variance.
Read it
- Total Variance — negative means you used more than expected (losses); positive means less (savings).
- Biggest Losses — waste, spillage, over-portioning candidates. The top three lines usually explain most of the gap.
- Biggest Savings — sustained “savings” on an item often means the recipe overstates quantities. Fix the recipe.
- Breakdown by Category — per-item actual vs theoretical, in dollars and percent.