1. Home — the weekly report
Home is the manager report: Net Sales vs last year, Labor %, Avg/Guest, Guest Count, Total Tips, plus Compliance & Hours KPIs — break compliance, Spread of Hours, Overtime, and who’s approaching overtime before it costs you. Flip Daily/Weekly tabs; skim Shifts Review.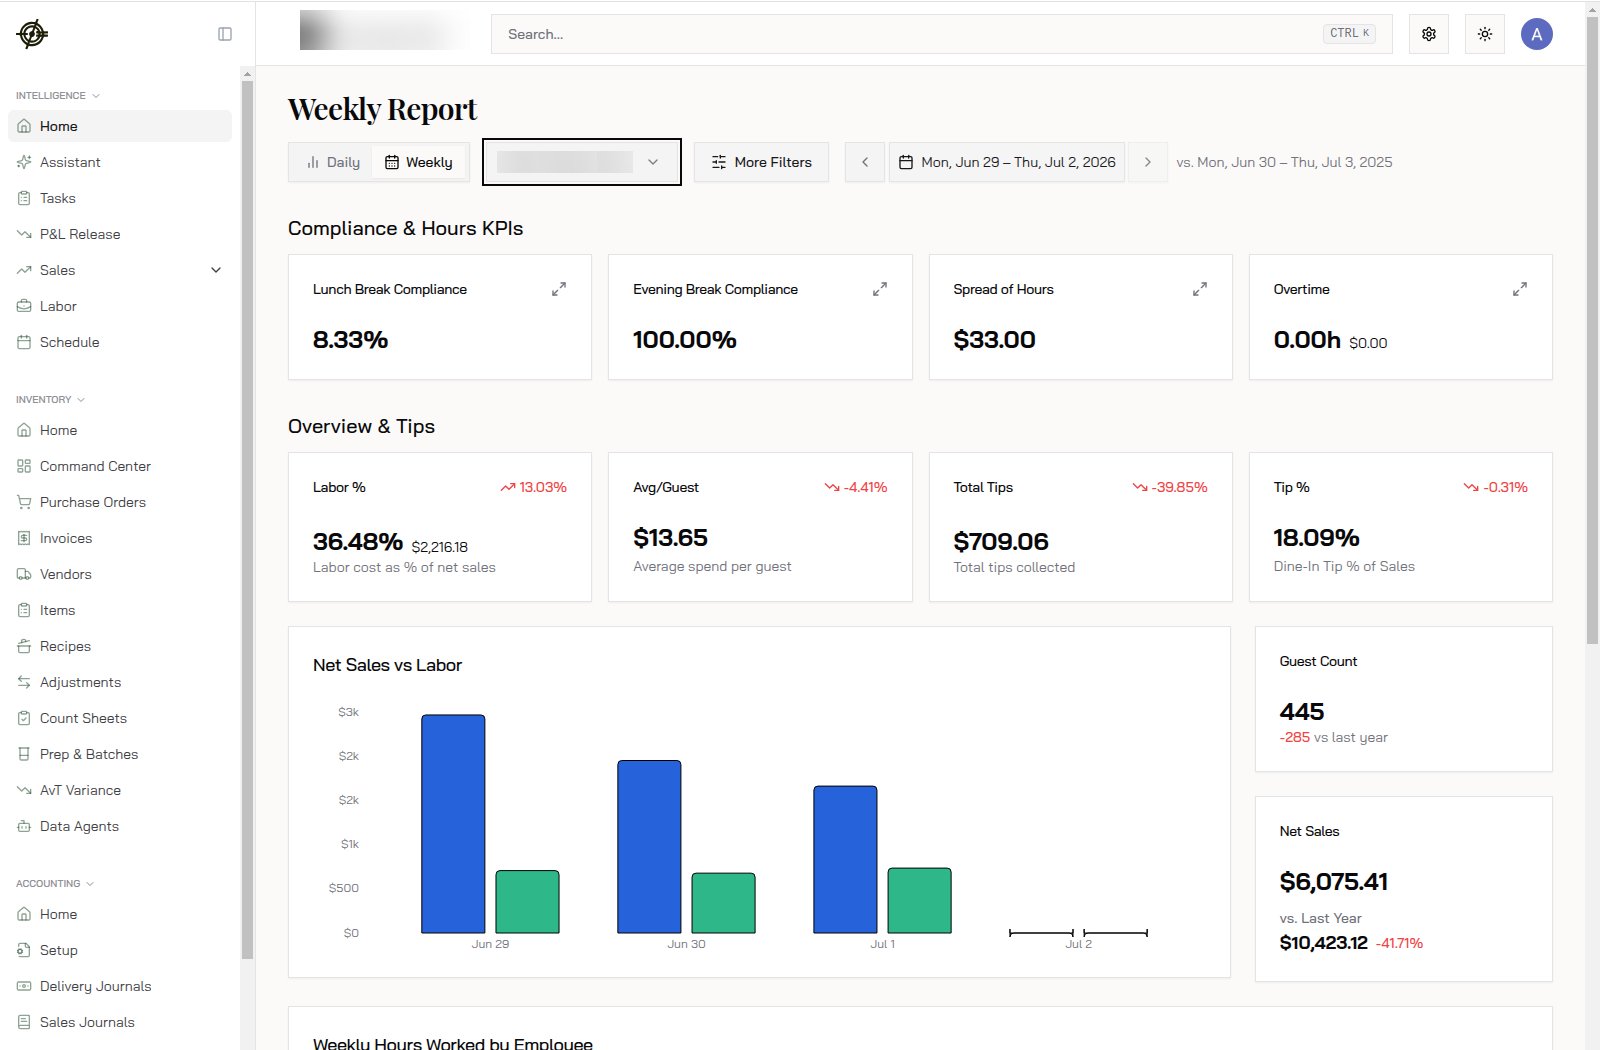
2. Sales
Sales → Overview: net sales over time, By Day of Week Averages, By Hour Averages (filter lunch/dinner). Staff to when the money actually shows up.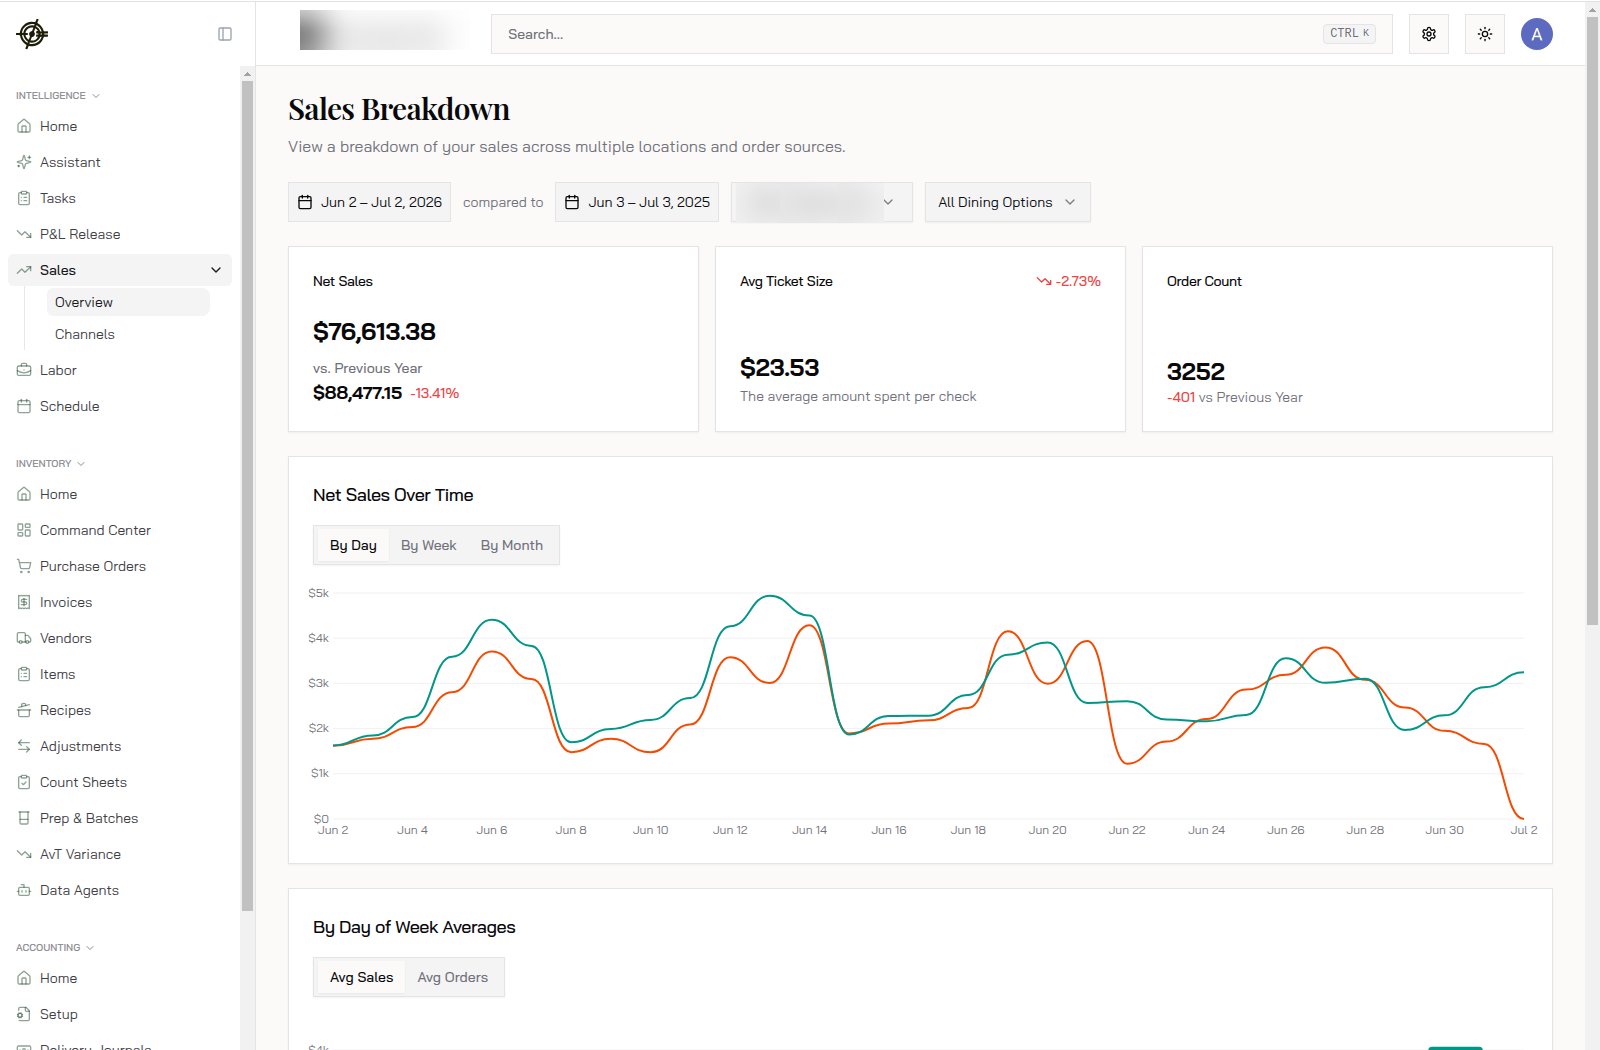
3. Labor
Labor splits Front of House / Back of House / Controllable / Total, each as % of sales against thresholds, with a Role Breakdown (by spending) and drill-in compliance violations. Average Ticket Time vs. Back of House Staffing answers whether extra kitchen hands actually speed up tickets.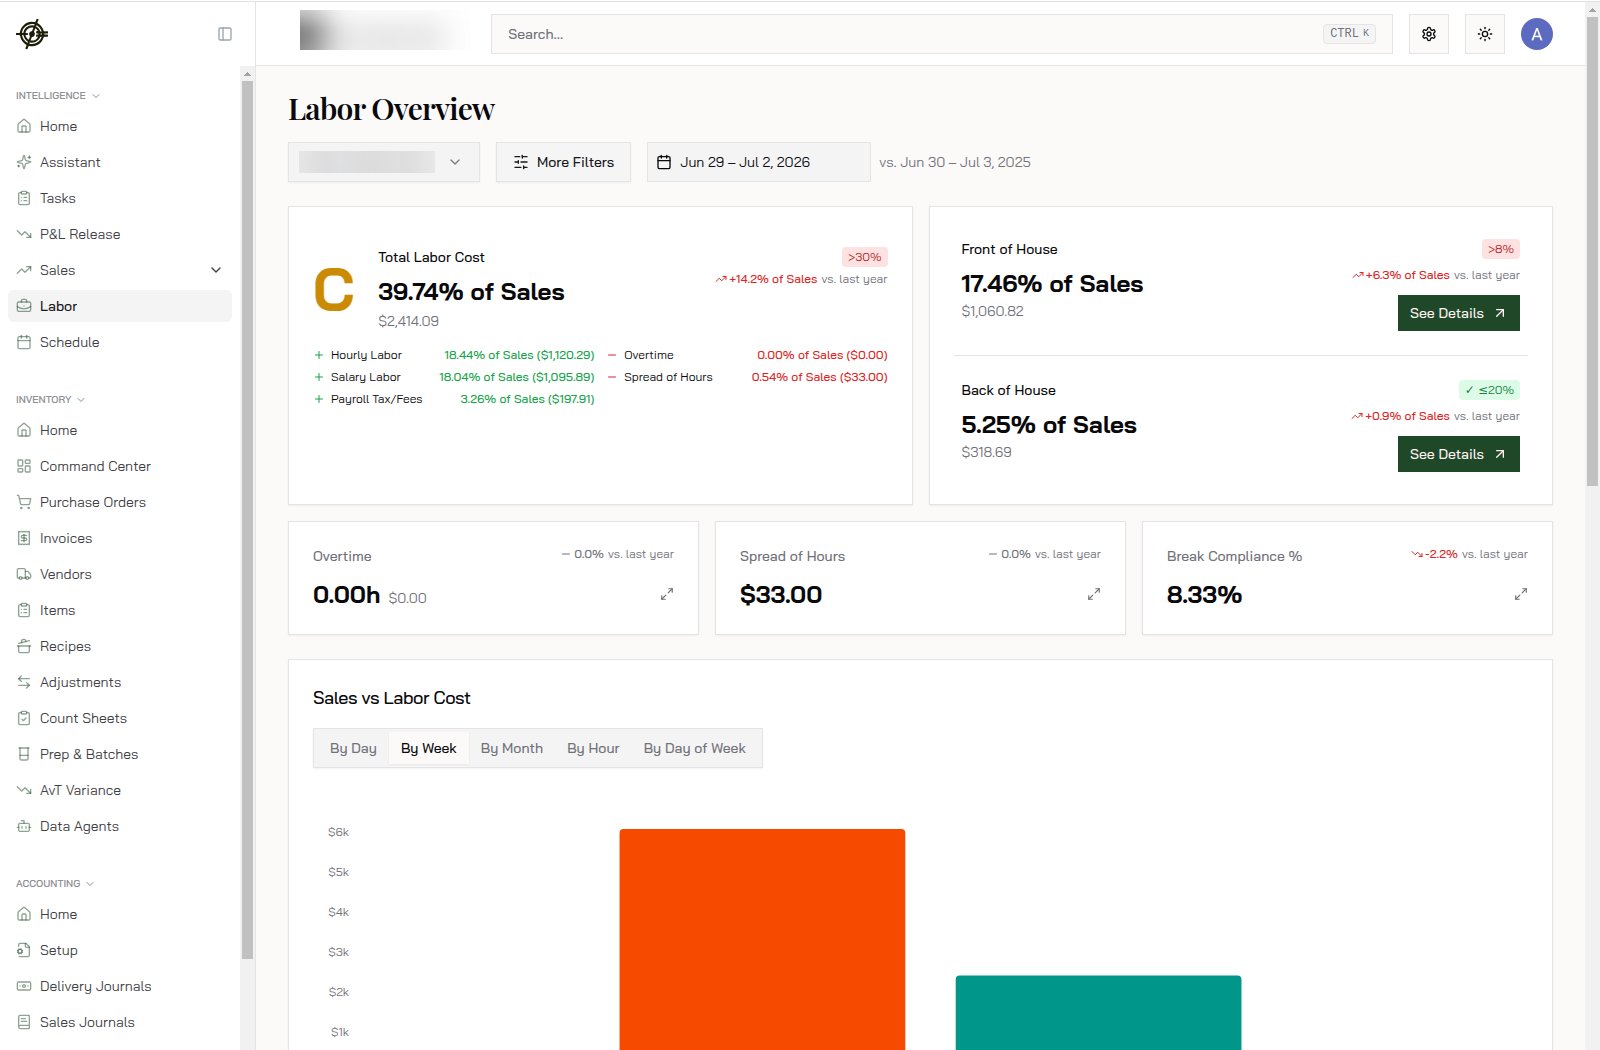
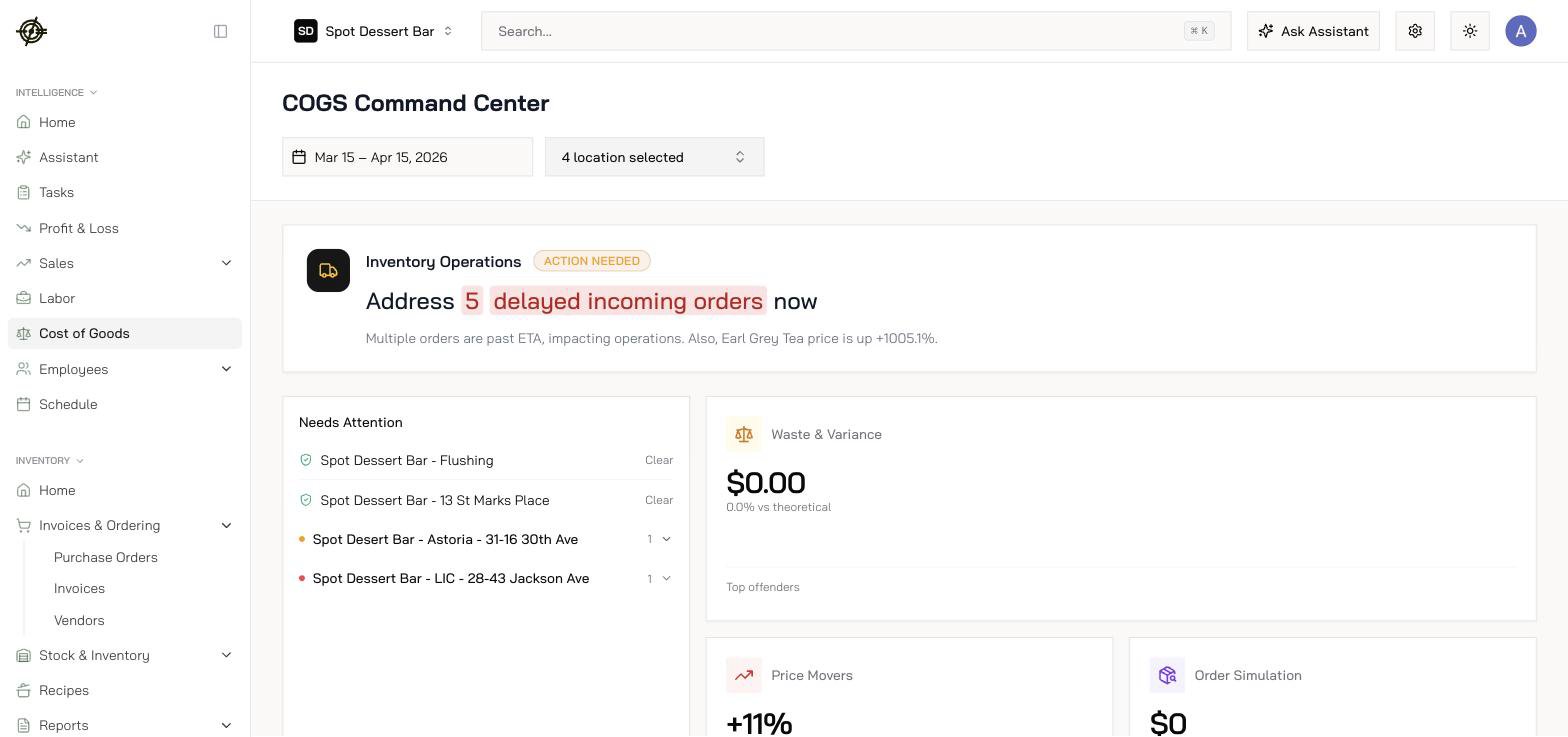
4. Cost of Goods
Cost of Goods is the inventory command center: Waste & Variance, Price Movers, Order Simulation, Incoming Orders, Inventory Turns, Cost / Margin, Fill Rate & Shorts, Batch Forecast & Simulate, Demand Velocity — one screen for “where is my food money going this week?”